
出海链的阿尔法如何寻找

天風證券認為,早佈局出海、全球化程度較高的行業龍頭能有效對沖國內需求不足,是出海鏈行情受益者。出海鏈需關注毛利率差異、風險偏好擾動等因素,尋找有效、有利可圖、風險可控的阿爾法。出海是長期趨勢,但需注意其波動性和不確定性。
要點:
如何理解出海和紅利背後邏輯的區別
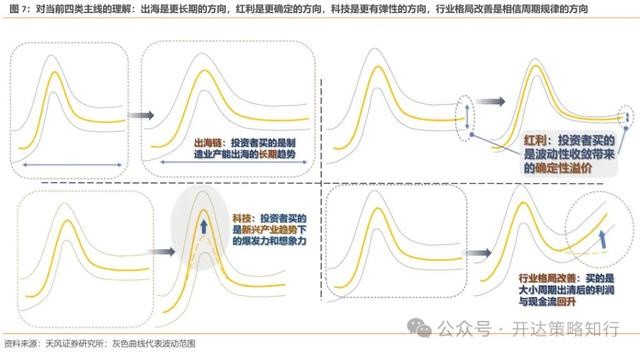
由於出海板塊內生的波動性,使得其本質邏輯或與紅利板塊有所不同:投資者投資出海鏈,買的是產能出海的長期趨勢;投資者投資紅利板塊,買的是波動性收斂下的確定性溢價。長期性和確定性往往難兼得,如果有則往往很 “貴”,能獲得較高的估值,這也是家電(既有較高股息率,也是較早進行出海佈局的行業)今年至今表現強勢的重要原因。
出海行為:部分資源和零售行業佈局早,近年新興中游製造密集出海
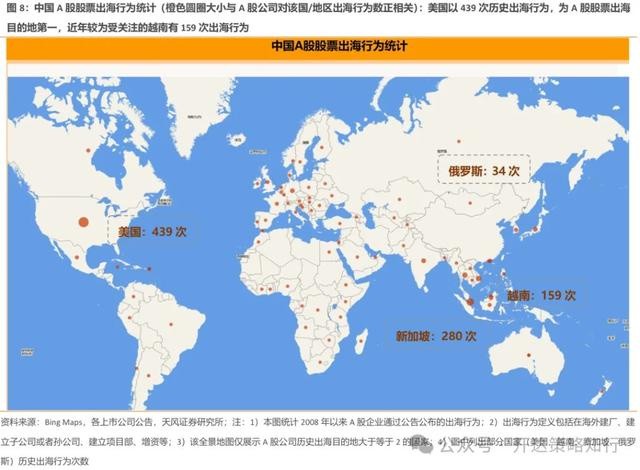
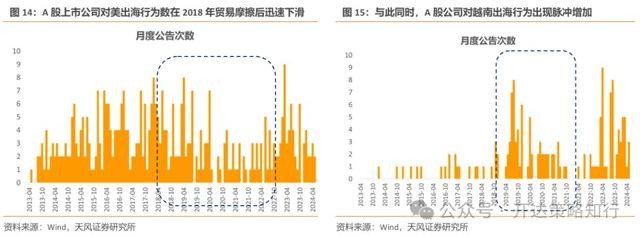
出海行為全景透視:A 股公司出海分佈總體集中在美國、東南亞、東亞,歐洲也有涉及但國家分散。美國以 439 次歷史出海行為位列 A 股股票出海目的地第一,而越南雖近年較為受關注,但基數較低,共有 159 次出海行為。從行業維度進行出海行為數統計,部分資源和零售行業佈局早,近年新興中游製造密集出海。
除了出海行為的數量在各行業/國家的分佈外,我們還關注出海行為的時間分佈:1)出海與出口有本質的不同,需要時間去消除不確定性。2)對於一家剛進行出海戰略的公司,實際上出海行為既是機遇也是風險。3)較早佈局出海、全球化程度較高的行業龍頭,能有效地對沖國內可能的需求不足,是出海鏈行情真正的受益者。
本土/出海毛利率差異:新興製造、機械製造類和部分傳統行業具有更強的出海動力
本土和海外的毛利率差異是我們強調的另外一個出海鏈分析視角,反映了企業未來有多大動力出海。
1)我們發現除輕工製造外各一級行業按照行業市值加權口徑出海毛利率均高於本土,而這一現象在簡單平均加權計算本土/出海毛利率時則所不同,有 7 個行業平均出海毛利率低於本土,這一現象指向龍頭出海邏輯更佔優。
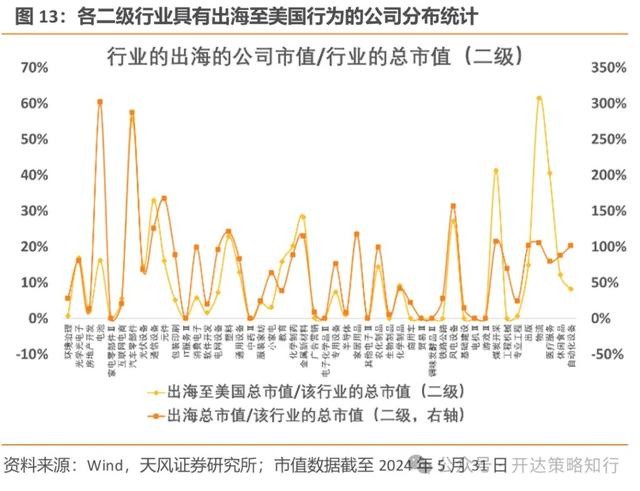
2)新興製造(電力設備、電子)、機械製造類(工程機械、汽車零部件)和部分傳統行業(紡服等)或都有較強的出海動能。我們將每個行業的公司分為本土毛利率高和出海毛利率高兩組,分別統計每個行業落在這兩組的公司市值。電力設備、汽車、食品飲料、交通運輸、鋼鐵、農林牧漁、建築材料等行業有更多市值的公司出海毛利率高於國內。
風險偏好擾動:關注對美收入佔海外收入比
出海的政策風險(美聯儲貨幣政策、關税政策、產業制裁和本地營商規則等)是出海鏈不確定性的來源之一,可能降低出海鏈投資的風險偏好。元件、半導體、紡織製造、油氣開採、汽車零部件和通信設備等板塊對美收入金額絕對值較高,且對美收入佔海外收入的比重也較高。
出海鏈的阿爾法如何尋找:需出海、出海需有效、有利可圖、風險可控
出海是長期趨勢,但出海鏈標的受海外經濟週期和政策影響(海外關税、產業制裁等)的內生屬性使其伴隨着波動和不確定性。
我們構建需有出海行為、出海需要有效(ROE 伴隨提升)、有利可圖(出海業務毛利率高於本土)、防範制裁風險(關注對美收入佔比)四大增量出海指標。我們篩選出相應的個股組合標的多分佈於中游製造,且較多行業具備新質生產力特性,回測顯示 24 年 2 月以來該組合相對萬得出海指數有明顯超額收益。特別地,由於我們的篩選中出現了 “ROE 伴隨提升” 的條件,這一條件嚴格來説與出海鏈指標體系關係不強,為排除 ROE 提升本身可能的阿爾法,我們去除 ROE 相關條件後進行再次回測,發現該出海組合 2024 年 2 月以來的超額依然明顯。
正文:
1. 為何出海是更長期的方向
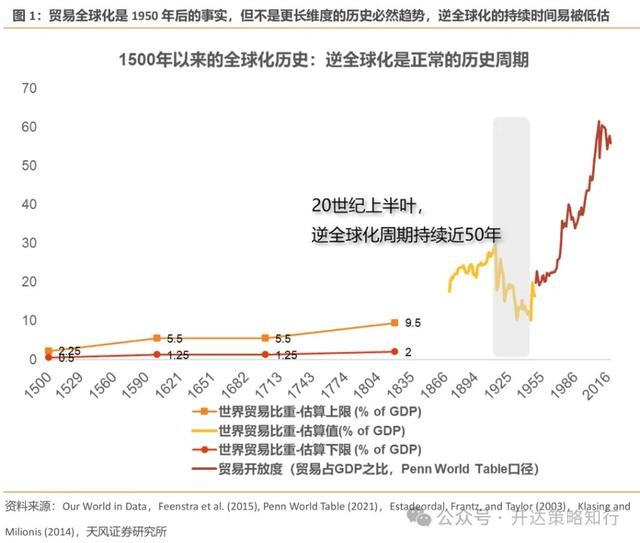
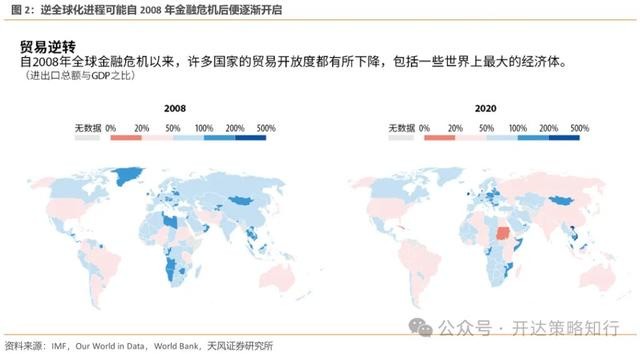
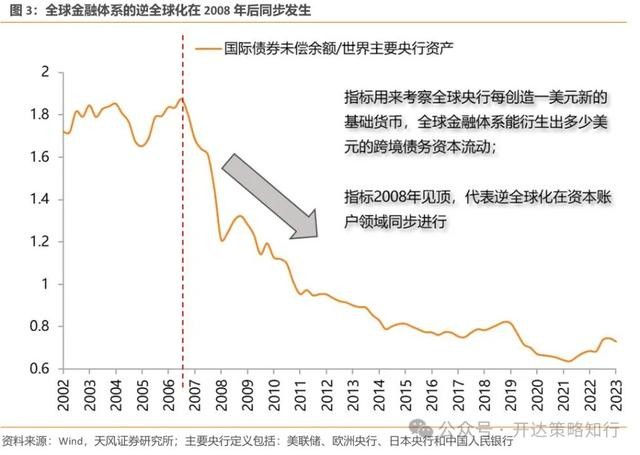
1.1. 逆全球化或仍持續較長時間
未來長期的逆全球化預期下,貿易壁壘帶來阻隔,制裁風險影響企業決策,企業出口向產能出海轉化是可以看得更長遠的方向。
1)逆全球化下,供應鏈安全的重要性邊際提升。面對政策不確定性、地緣衝突等不確定因素,生產製造的高度集中化、過分依賴單一國家可能存在較大的風險。
2)部分國家或加碼從中國進口商品關税,需從出口向出海轉移以應對。例如,越南生產的產品在出口到美國時關税低或無額外的關税(根據《美越雙邊貿易協議》(BTA),越南產品進入美國時的平均關税率已經從 40% 降低到 3%[1]),而中國出口至美國產品則關税遠高於此,且或有加碼。
1.2. 中國自身供需格局需長期出海破解
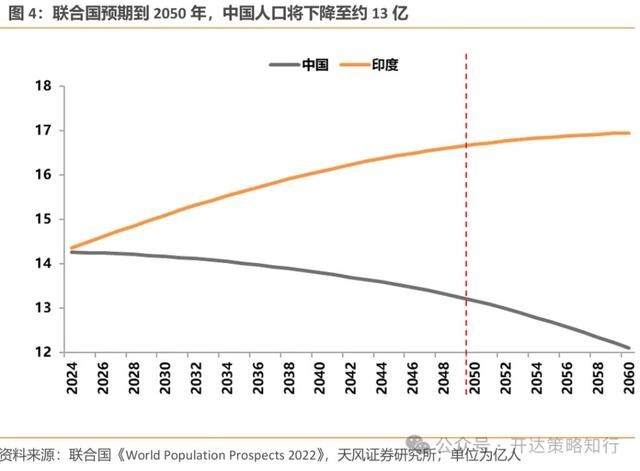
人口的長期趨勢和我國步入發展的新階段決定了出海是長期的趨勢。隨着我國經濟的發展和人民收入水平的提高,而人口增長率下滑,在很多傳統行業和低端環節,中國作為 “世界工廠” 的人力成本優勢較其他發展中國家有所削弱。
1)勞動力供給角度看,聯合國《世界人口展望 2022》預期到 2050 年中國人口將下降至約 13 億,2100 年下降至約 8 億,勞動人口下降,工資成本上升,企業出海去低工資國家投資設廠,既可以降低成本,又可以規避歐美對原產中國的商品加徵的關税。
2)從需求和消費端看,隨着老齡化率的上升,人口數量下降,國內總需求增速下降,國內市場規模或難消化更多的產能。
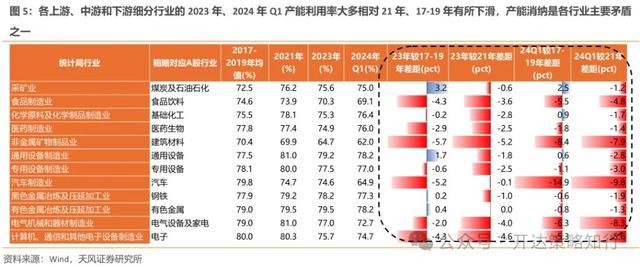
當下需求較疲軟是大多數行業面臨的問題,製造業產能逐漸轉移出海是供給側的必然訴求。除了過去的勞動力成本優勢外,中國在製造業領域的優勢還有相對完備的基礎設施、國內較為龐大的市場規模等,因此,在產業趨勢初期,企業往往增加資本開支,迅速擴張產能佔據市場,以期望在產業出清時成為存活下來的龍頭。當前各上游、中游和下游細分行業的 2023 年、2024 年 Q1 產能利用率大多相對 21 年、17-19 年有所下滑,產能消納是各行業主要矛盾之一,當前供需格局的問題需以產能出海破解。
1.3. 出海是長期趨勢,但出海鏈並非確定性較強的防禦板塊
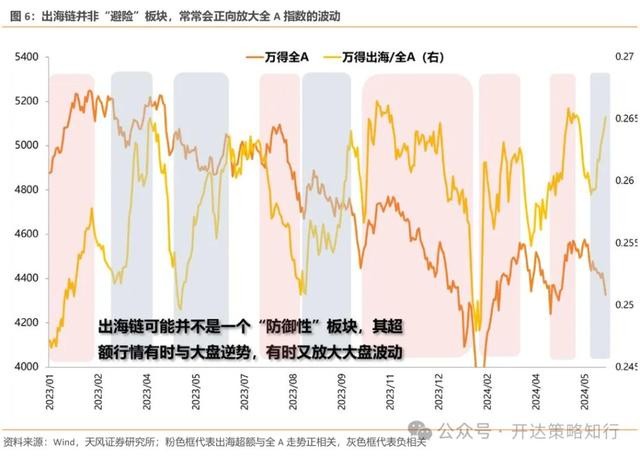
出海鏈受海外經濟週期和政策影響(海外關税、產業制裁等)的內生屬性使其伴隨着波動和不確定性,出海或非類似紅利的 “防禦性” 板塊。覆盤 2023 年出海鏈的行情演繹,我們發現出海板塊行情的超額收益經常與萬得全 A 指數自身走勢正相關,反而常常會正向放大全 A 指數的波動,並非 “避險” 板塊。我們認為背後邏輯主要在於:
1)當全 A 調整的邏輯主線為內需較差時,此時出海相對佔優,那麼出海鏈或可在大盤下跌時成為資金暫時的合力方向,跑出超額行情;
2)當全 A 調整的邏輯主線本身就來自於外需邊際走弱、國際地緣政治波動或關税政策等出海板塊更為敏感的因素時,那麼出海板塊反而會正向放大全 A 指數的波動,在全 A 調整時跌幅更大。
1.4. 對當前各主線行情的思考:如何理解出海和紅利背後邏輯的區別
由於出海板塊內生的波動性,使得其本質邏輯或與紅利板塊有所不同:投資者投資出海鏈,買的是產能出海的長期趨勢;投資者投資紅利板塊,買的是波動性收斂下的確定性溢價。投資主線的長期性和穩定性往往難兼得,如果有,往往很 “貴”,能獲得較高的估值,這也是家電(既有較高股息率,也是較早進行出海佈局的行業)今年至今表現強勢的重要原因。
進一步擴展總結,我們在下圖(圖 7)中對科技和行業反轉這兩類邏輯也進行透視,系統性歸納當前市場的四類行情主線。
2. 出海鏈研究的增量數據:出海行為、毛利率差異與對美收入
2.1. A 股公司出海去哪些國家?
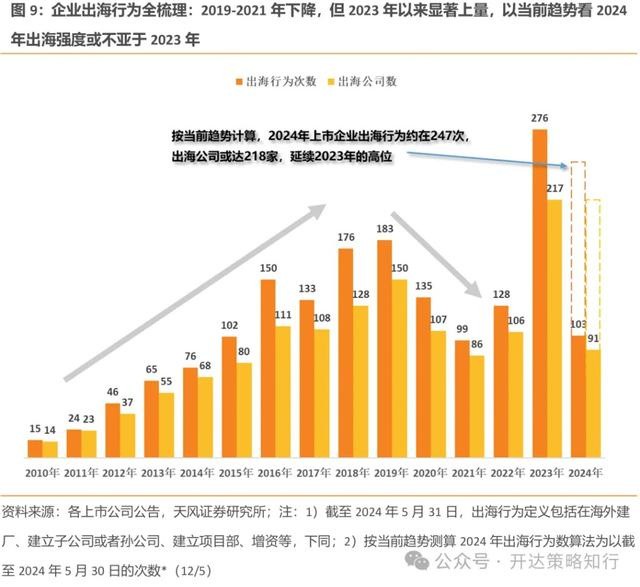
對於上市企業的出海行為,我們從歷史的公司公告入手以下列方法進行梳理,最終形成出海行為 - 出海時間 - 出海目的國家(地區)的出海全景數據。
1)首先,基於公司公告的屬性進行初篩,選擇資金投向相關的公告,時間範圍為 2008 年至今(2024 年 5 月 31 日);
2)我們對出海行為定義包括在海外建廠、建立子公司或者孫公司、建立項目部、增資等,我們利用關鍵字處理搜索對應內容公告;
3)對篩選出來的公告,進行語義分析,提取其中涉及的出海目的地國家或地區;
4)進行人工核對和確認。
A 股公司出海分佈總體集中在美國、東南亞和東亞,歐洲也有涉及但目的地較分散。結果顯示,美國以 439 次歷史出海行為,位列 A 股股票出海目的地第一,而越南雖近年較為受關注,但基數較低,有 159 次出海行為。
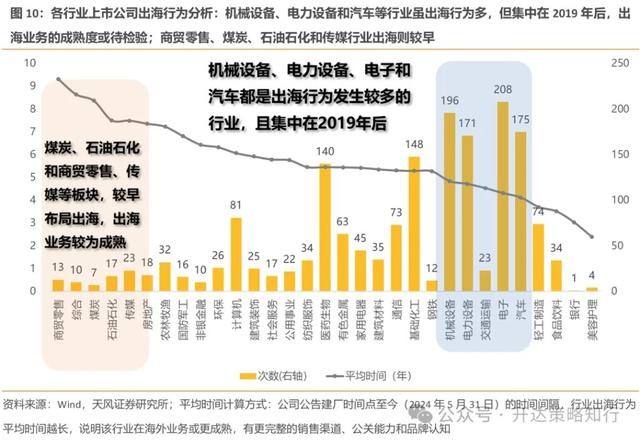
2.2. 部分資源和零售行業佈局早,近年新興中游製造密集出海
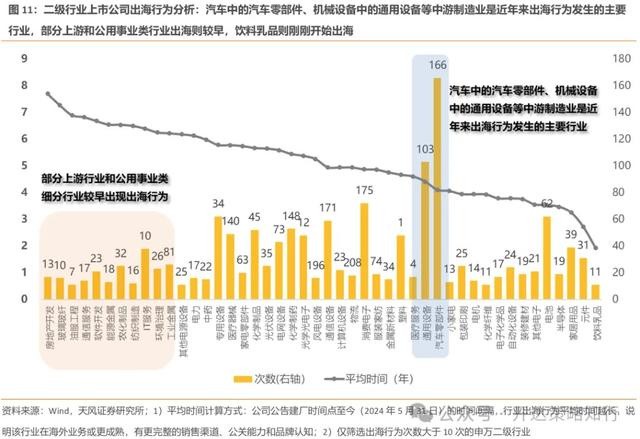
從行業維度進行出海行為數統計,一級行業中,機械設備、電力設備、電子和汽車都是出海行為較為多的行業;二級行業看,汽車中的汽車零部件、機械設備中的通用設備等中游製造業是近年來出海行為發生的主要行業。除了出海行為的數量在各行業/國家的分佈外,我們還關注出海行為的時間分佈:
1)出海與出口有本質的不同,需要時間去消除不確定性。出海要求產能、渠道和經營行為在外,在海外需要建立完整的銷售渠道、品牌認可和政府關係,這些因素能否建立、能否穩定持續,需要較長的時間來進行確認。
2)對於一家剛進行出海戰略的公司,實際上出海行為既是機遇也是風險。出海行為本質是一類投資擴張行為,失敗的投資行為對公司 ROE 有所折損,因此,我們對年限較短的出海行為,偏向認為其對公司影響相對中性。
3)較早佈局出海、全球化程度較高的行業龍頭,能有效地對沖國內可能的需求不足,是出海鏈行情真正的受益者。那些較早走到海外,在本地深耕十數年,並在當地獲得了較高知名度、甚至收購了大量本地品牌的公司,可以認為是真正出海成功、成為跨國經營的企業,這類企業在當前我國與海外經濟週期異步的大環境下,能較好地熨平週期、受益於出海鏈行情。
3. 本土/出海毛利率分析:另類視角觀察企業出海的內生動能
本土業務和海外業務的毛利率差異是我們強調的另外一個出海鏈分析視角,反映了企業未來有多大動力出海。不同於常用的海外收入佔主營收入比重等側重於歷史數據的財務指標,出海毛利率 - 本土毛利率的差值反映了企業是否在出海行為上 “有利可圖”,決定了企業未來的出海動能。在當前各行業需求相對疲軟,各細分行業的 2023 年以來產能利用率大多相對 21 年、17-19 年有所下滑的背景下,產能出海有其必要性,而中觀和微觀視角的毛利率差異則類似河流的 “落差”,決定了企業出海的內生積極性和持續性。
3.1. 方法:文本逐一提取並匯總分析
企業或在財報中選擇性披露本土/出海的毛利率,但是否披露和披露口徑並不強制。分地區字段可能顯示為 “國內/國外”、“中國/海外”、“中國/日本/美國” 等等,具備一定隨機性。我們對全 A 上市公司進行全分析,最終找到 2234 家公司財報中同時披露本土/海外毛利率的公司。

3.2. 結論一:龍頭出海賺錢能力更強,出海龍頭邏輯佔優
龍頭出海毛利率更有優勢。我們對上述樣本進行了分析比對,發現除輕工製造外,各申萬一級行業按照行業市值加權口徑出海毛利率均高於本土,而這一現象在簡單平均加權計算本土/出海毛利率時則所不同,有 7 個行業平均出海毛利率低於本土,這一數據特點指向龍頭出海邏輯或更佔優。


3.3. 結論二:新興製造、機械製造和部分傳統行業等板塊或有更強出海動能
新興製造(電力設備、電子)、機械製造類(工程機械、汽車零部件)和部分傳統行業(紡服等)或都有較強的出海動能。我們將每個行業的公司分為本土毛利率高和出海毛利率高兩組,分別統計每個行業落在這兩組的公司市值。一級行業中,電力設備、汽車、食品飲料、交通運輸、鋼鐵、農林牧漁、建築材料等行業中,有更多市值的公司出海毛利率高於國內;而二級行業中,電池、汽車零部件、光學光電子、自動化設備、塑料和紡織製造等二級行業,有更多市值的公司出海毛利率高於國內。行業中越高比例的樣本出海毛利率高於本土,或説明該行業出海更 “有利可圖”,未來有更強的出海動能。


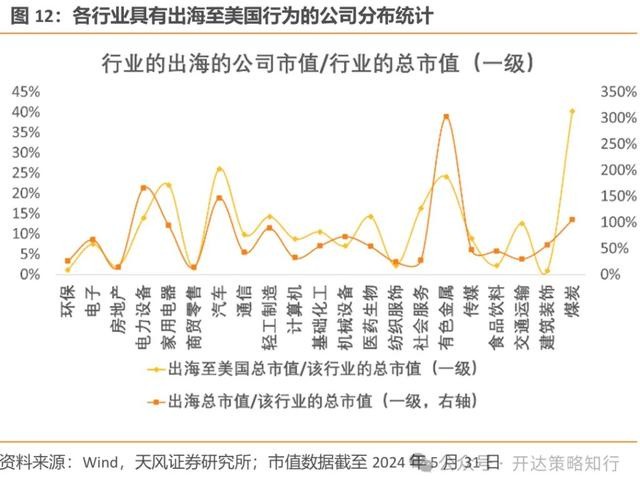
4. 風險偏好視角:哪些行業對美收入佔比較高?
出海的政策風險(關税政策、產業制裁和本地營商規則等)是出海鏈不確定性的來源之一,可能降低出海鏈投資的風險偏好。我們嘗試按照各上市公司財務附註中披露的海外營收數據、對美營收數據,篩選出對美收入敞口較高的行業。元件、半導體、紡織製造、油氣開採、汽車零部件和通信設備等板塊對美收入金額絕對值較高,且對美收入佔海外收入的比重也較高。

5. 在出海鏈中尋找超額收益
出海是長期趨勢,但出海鏈標的受海外經濟週期(包括美聯儲貨幣政策)和政策影響(海外關税、產業制裁等)的內生屬性使其伴隨着波動和不確定性,需在出海鏈中尋找增量指標體系,深挖新的阿爾法。
我們根據前文框架和數據,形成了需出海(營收不僅來源於出口,也需有出海行為公告記錄)、出海需要有效(ROE 伴隨提升)、有利可圖(出海業務毛利率高於本土)、防範制裁風險(關注對美收入佔比)四大增量出海指標。從指標體系出發,篩選出相應的個股組合。
組合標的多分佈於中游製造,且較多行業具備新質生產力特性,回測顯示較萬得出海指數超額收益顯著且穩健。24 年 2 月以來該組合相對出海指數有明顯超額收益。特別地,由於我們的篩選中出現了 “ROE 伴隨提升” 的條件,這一條件嚴格來説與出海鏈指標體系關係不強,為排除 ROE 提升本身可能的阿爾法,我們去除 ROE 相關條件後進行再次回測,發現該出海組合 2024 年 2 月以來的超額依然明顯。


本文作者:吳開達(執業編號:S1110524030001),來源:開達策略知行,原文標題:《出海鏈的阿爾法如何尋找 | 天風策略政策吳開達團隊》
