
Warning! "Buffett Indicator" Issues a Warning: U.S. Stocks Are Just Too Expensive

巴菲特指標向投資者發出警告,美股估值過高。根據巴菲特指標,美股的總市值與國內生產總值的比例已經上升到自 2022 年以來的水平。過去,這一比例上升曾預示着標普 500 指數的大幅下跌。此外,其他流行估值指標也顯示股票估值過高。然而,巴菲特指標有一些缺陷,如不考慮利率和國外企業利潤份額增加等因素。投資者應密切關注這些指標的變化。
巴菲特指標正在向投資者發出警告。
一位對沖基金創始人認為,這一指標發出的信息非常明確,即美股看起來非常昂貴。巴菲特指標是 “將所有交易活躍的美國股票的總市值除以最新季度國內生產總值 (GDP) 的估計值”。早在 2001 年,巴菲特表示,這 “可能是任何時候衡量估值狀況的最佳單一指標”。
在七月初,這一比例上升到 2 以上,達到了自 2022 年初以來未見的水平。根據 FactSet 的數據,上次這一比例上升時,預示着標普 500 指數自 2008 年以來最糟糕的年度跌幅。
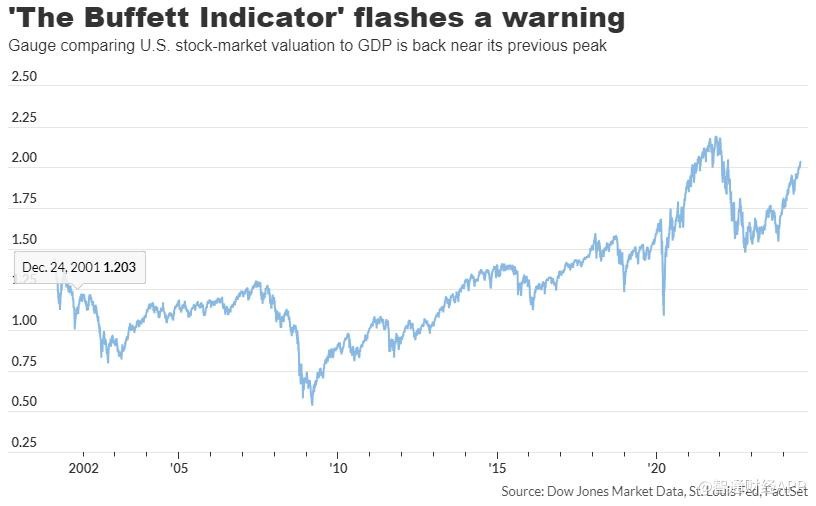
對沖基金 Seabreeze Partners Management 創始人 Doug Kass 表示:“將近兩年前,這一比例上升到前所未有的水平。這應該是一個非常強烈的警告信號。”
值得注意的是,巴菲特本人已經不再依賴該指標,但像 Kass 這樣的投資者仍然使用它來幫助確定股票是便宜還是昂貴。
該指標在過去相當可靠也不無道理。此前它顯示相對於美國經濟產出股票極度高估的情況,分別預示了 1987 年和 2000 年的重大拋售,以及金融危機前夕。
總體而言,Kass 表示,當該指標達到其長期平均值的兩倍標準差時,投資者應該開始注意。今天它正處於這個水平。
目前,巴菲特指標並不是唯一一個表明股票估值過高的信號。Kass 表示,包括過去 12 個月的市盈率、市銷率和企業價值與銷售比率在內的其他流行估值指標,相對於歷史都處於 90% 以上的百分位。
像其他指標一樣,巴菲特指標也有其缺陷。一個問題是它不考慮利率,而目前利率處於 20 多年來的最高水平。Kass 補充指出,它還沒有考慮到來自國外的企業利潤份額不斷增加這一事實。“投資組合非常複雜,沒有一個指標是鐵板釘釘的。”
另一個今天獨有的潛在問題是,過去 18 個月市場的大部分漲幅都是由少數大盤股推動的。這意味着該指標可能忽略了許多股票相對於歷史仍然便宜的觀點,而少數股票極度昂貴。
根據 FactSet 的數據,標普 500 指數週二達到了今年的第 36 個紀錄收盤點。納斯達克綜合指數也創下新高,而道瓊斯工業平均指數則再次落後,處於下跌狀態。
