
The summer selling wave is becoming more like a "little episode" in the midst of the bull market in US stocks
隨着美國及亞歐股市反彈,夏季的股市拋售被視為牛市的短暫停頓。美國經濟軟着陸預期、企業強勁的股票回購及盈利增長,推動市場對經濟衰退的擔憂減弱,資金流向風險資產。全球股市恢復強勁,標普 500 指數距離歷史高點僅 2.2%。股市拋售幅度相較於歷史事件較小,對美股未來走勢仍顯信心。此外,美國總統大選及中東局勢帶來不確定性。
隨着美國股市,以及亞歐地區多數股票市場大舉反彈,今年夏天的 “股市大拋售” 看起來更像是此輪牛市的 “暫停式小插曲”,而不是牛市結束的開端。在美國經濟 “軟着陸” 預期,美國企業無比強勁的股票回購規模以及持續擴張的盈利增長預期推動之下,美股以及全球股市長牛走勢有望持續堅挺。
市場對美國經濟衰退的擔憂明顯緩解並且市場重新聚焦於美國經濟 “軟着陸”,以及日元套利平倉交易風波暫時告終,推動全球資金重新流向股票等風險資產,並且交易員們普遍押注美聯儲將於下月開啓降息週期,全球股市在本週可謂大舉反彈。
在亞洲,日本與韓國股市的基準股指紛紛收復 “黑色星期一” 全部跌幅。歐洲股市則在週五開盤後繼續上漲,並且有望創下三個月來最大規模的單週漲幅,距離曾創下的歷史最高位越來越近。標普 500 指數在本週則有望創下 10 月以來最大的周度漲幅,並且該基準指數已收復 8 月份的全部跌幅,目前距 7 月中旬的歷史最高點位僅 2.2%。
當然,交易員們一直在努力預測經濟的走向,而推動全球市場回調的美國經濟衰退擔憂可能會像近期迅速消退之勢一樣再次出現。除此之外,美國總統大選和中東地緣政治緊張局勢也增加了其他不確定因素。
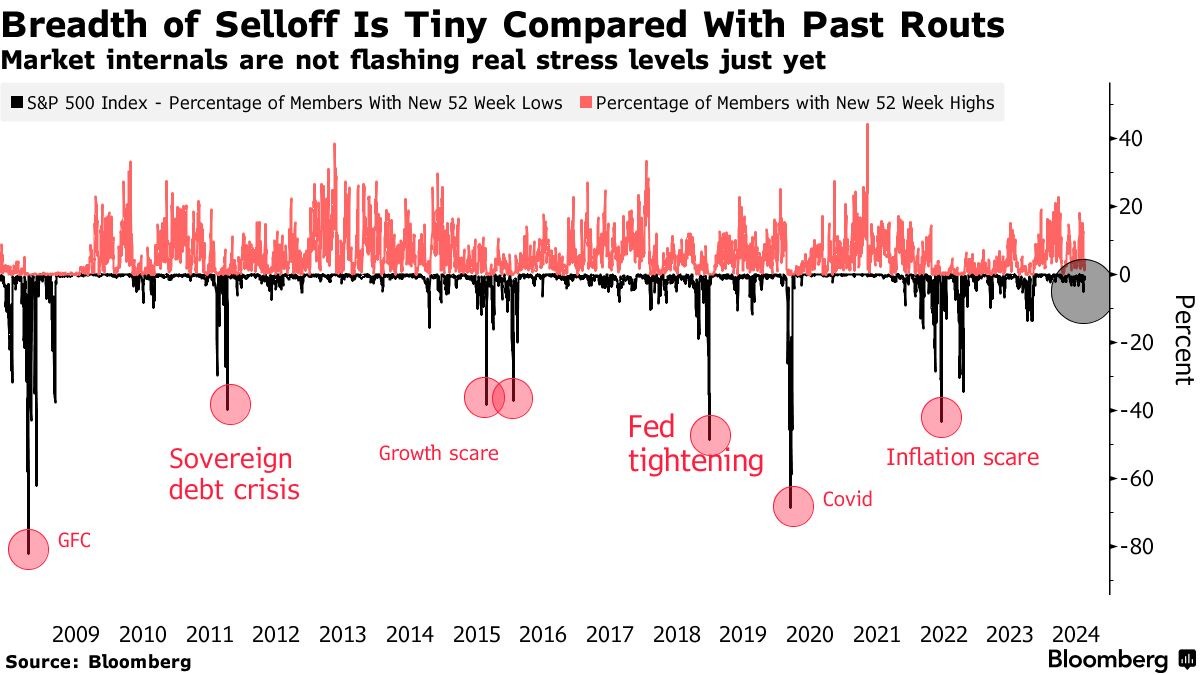
但在表面之下,仍然有一些令人放心的實質信號。其中:此次全球股市拋售僅觸及市場容量的一小部分,遠不及美聯儲激進加息週期、新冠疫情和其他關鍵黑天鵝事件所引發的崩盤廣度。儘管如果美國經濟真的陷入衰退或滯脹,估值可能會面臨再次調整的風險,但美股基準指數——標普 500 指數在最近的回落中堅挺地保持在某個閾值之上,至少對於技術分析師們來説,這表明全球資金對於美股長牛仍有信心。
相比於其他暴跌時期,這一輪拋售浪潮規模顯得渺小
雖然上個月開始的美股下跌幅度很大,並且速度非常快,導致以科技股為主的納斯達克 100 指數在三週內出現技術性點位調整,但這是由少數股票所推動——即佔據高額權重的美股七大科技巨頭。
以英偉達、微軟以及蘋果為首的佔據納斯達克 100 指數以及標普 500 指數的七大科技巨頭 (Magnificent 7) 自 2023 年以來股價持續暴漲,但近期這些科技巨頭因估值處於歷史最高位附近,以及因 AI 貨幣化前景模糊、谷歌和微軟等巨頭大規模 AI GPU 等基礎設施投資可能傷及巨頭們利潤率這些因素合力而觸發暴跌走勢。
七大科技巨頭,即 “Magnificent 7”,包括:蘋果、微軟、谷歌、特斯拉、英偉達、亞馬遜以及 Meta Platforms。全球投資者們在 2023 年全年以及 2024 年上半年持續蜂擁而至七大科技巨頭,他們紛紛押注,在全球企業紛紛斥巨資佈局生成式 AI 的這股狂熱浪潮之下,由於這些巨頭們具備龐大市場規模和財務實力,它們處於利用人工智能技術擴展營收的最佳位置。
根據機構彙編的數據,在下跌最深的時候,標普 500 指數中僅僅約 5% 的成分股跌至一年低點。這意味着此次下跌的範圍比之前由重大宏觀經濟變化或者重大黑天鵝事件所引發的下跌幅度要小得多。在通脹飆升推動美聯儲在 2022 年開啓激進加息週期後,該指數曾經有接近一半的成分股跌至 12 個月低點。此外,新冠疫情期間這一比例上升至大約三分之二。
“遲來的健康調整”
統計數據顯示,在上個月之前,標普 500 指數經歷了自 2007 年全球金融危機爆發以來最長時間的連續上漲——即長期沒有出現單日跌幅超過 2% 的情況。從某種角度來看,這使得 “夏季大回調” 看起來早就應該發生,被一些華爾街分析師稱為 “遲來的健康調整”。
與堪稱 “全球科技股風向標” 的納斯達克 100 指數完全不同的是——該指數的大幅回調反映了人們對科技巨頭們估值過高的長期醖釀擔憂,美股基準股指標普 500 指數從未跌破技術性的關鍵修正區間,而是在從峯值僅下跌 8.5% 後迅速反彈。
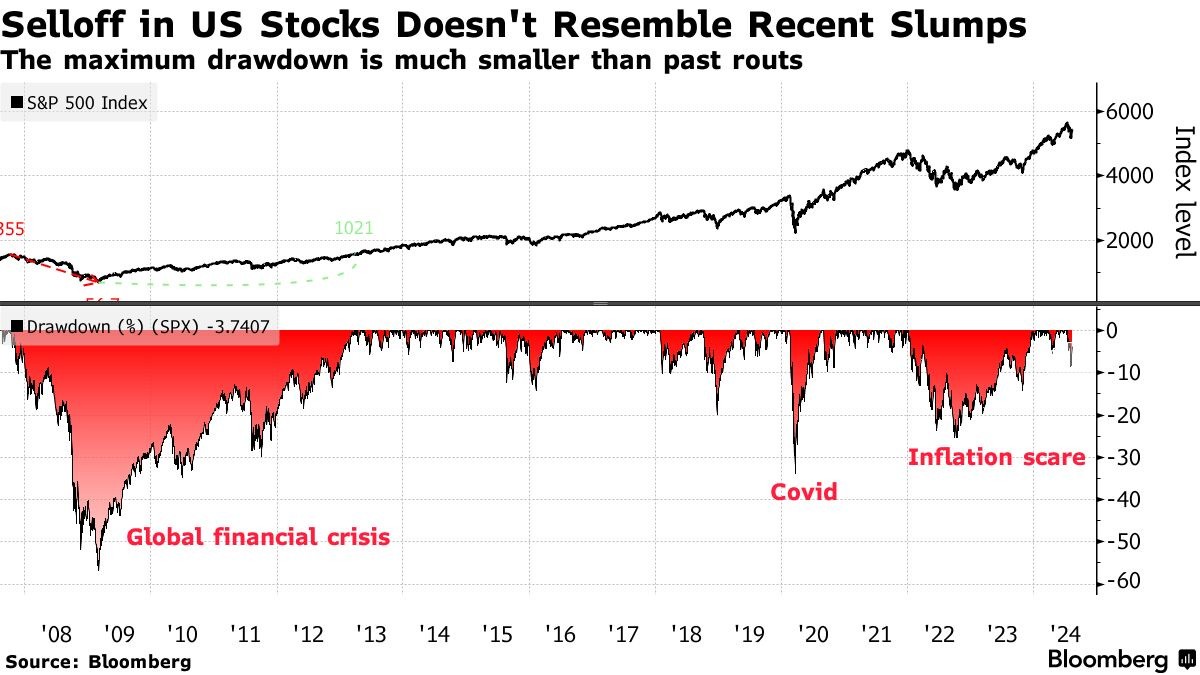
作為對比,在 2022 年全球股市暴跌期間,標普 500 指數在 2023 年持續大反彈之前的那一年大幅下跌高達 25%。在全球金融危機期間,該指數暴跌超過 57%,隨後用了足足四年時間才完全收復金融危機期間的全部跌幅。
持續高於關鍵水平
自世紀之交以來,標普 500 指數的 200 周移動平均線一直是該指數最強勁的技術層面關鍵指標。該基準指數在 2016 年經濟增長恐慌、2018 年中美貿易戰升級以及 2022 年美聯儲激進加息週期時期曾下破至這一關鍵水平,隨後該指數迅速開啓反彈。
這一次,在 8 月份的夏季拋售大浪潮中,即使在最低點,該指數也遠未達到這個關鍵的技術門檻。雖然這也表明指數在潛在的新一輪拋售中有可能進一步下跌,但它更大程度上暗示投資者們有足夠的信心堅信本輪調整已經觸底,因此選擇在市場測試新底部之前大舉逢低買入以便能夠及時趕上 “長牛列車”,這也是近期標普 500 指數大幅反彈的邏輯之一。

日本全面反彈
日本股市,為處於全球動盪的最中心,其貨幣政策收緊導致日元匯率達到今年最高水平之一,促使對沖基金拋售股票等流動性較高的風險資產,以解除由日元低成本貸款融資主導的日元套利交易倉位。
當日元迅速升值時,這種套利交易的風險顯著增加。由於借入的是日元,如果日元升值,加槓桿的外匯交易員們必須以更高的價格回購日元來償還借款。這會導致他們的實際回報大幅減少,甚至可能出現大額虧損。
同時,當日元匯率快速升值時,交易員為了彌補潛在的虧損,通常會選擇迅速平倉,這意味着大量賣出他們手中流動性較高的股票和垃圾債券等其他風險資產以回購日元,並且由於日元乃傳統意義上的避險貨幣,一些交易員可能更大規模地拋售風險資產以購入日元,在全球市場動盪的情況之下規避風險,這也使得整個金融市場在上週一陷入拋售股票等風險資產的慘烈惡性循環。
目前,隨着日本央行副行長內田真一發表聲明安撫市場情緒,強調在市場不穩定的情況下,日本央行不會選擇繼續提高政策利率,日元匯率全面下行。日本央行的政策制定者以及日本政府近期迅速向市場保證,至少短期內進一步加息的可能性已經排除,這也影響了日本股市,日元貶值促使外資繼續流入日本市場,推動日本股市徹底收復 “黑色星期一” 所觸發的全部跌幅。

警告聲音仍然存在
另一方面,美聯儲遲遲未開始降息的經濟風險並沒有消失。因此,最近的反彈意味着更多的由降息引發的美國經濟 “軟着陸” 預期正在被消化,如果事實證明是錯誤的,市場將面臨另一次大幅回調。
投資者們所依賴的市場定價指標可以從與經濟週期密切相關的股票 (即所謂的週期性行業) 相對於其風險較低的同行的落後表現中看出。
華爾街大行高盛編制的一籃子股票指數顯示,雖然週期股最近表現落後於防禦股,意味着市場仍在定價 “美國經濟衰退” 這一悲觀預期,但好的一面在於它們的交易價格仍基於經濟擴張預期。

週四,美國零售銷售額額意外的大幅增長極大程度證實了軟着陸這一一觀點。但之前的數字也表明,就業增長正在降温,製造業活動也在減少。
來自 Northwestern Mutual Wealth Management 的首席股票投資組合經理馬特·斯塔基表示:“我絕不是要引起恐慌,但與其他的資產類別相比,標普 500 指數似乎僅僅消化了很少程度的不確定性。”
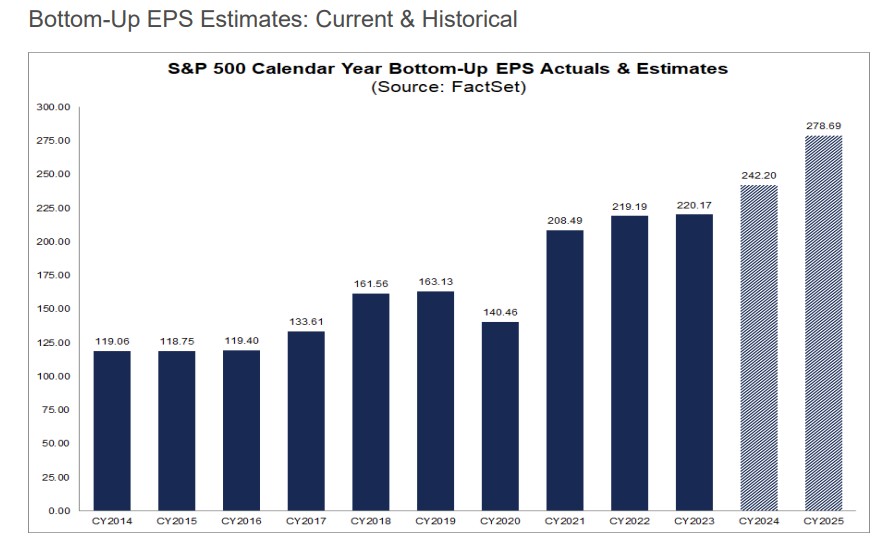
回購規模與盈利預期或將推動標普 500 指數長牛走勢
在華爾街多頭們看來,美國企業無比強勁的股票回購規模以及持續擴張的盈利增長預期推動之下,美股以及全球股市長牛走勢有望持續堅挺。
在美國股市上週陷入去年 10 月以來最嚴重的回調之際,美國上市公司可謂是逢低買入的大買家之一。標普 500 指數連續四周下跌之際,高盛負責為客户執行股票回購的部門收到了創紀錄的訂單,交易量飆升至去年日均水平的 2.1 倍。美國銀行的企業客户也掀起了購買狂潮,這些客户的股票回購速度加快,連續 22 周高於季節性水平。
隨着第二季度財報季接近尾聲,各大上市公司正從回購的沉寂期中走出來。從已公佈的計劃來看,它們的需求將保持旺盛。這對利用夏季回調搶購股票的散户或機構投資者來説都是好消息。
高盛交易部門預計全年標普 500 指數成份公司的累計實際股票回購規模約為 9600 億美元,並且預計 2025 年累計股票回購規模將增長超 15%,至大約 1.1 萬億美元。自 2023 年步入 “技術性牛市” 後,2024 年美股繼續高歌猛進,而如此龐大的回購規模無疑將成為美股長牛走勢的核心催化劑之一。
高盛預計,美國股票市場的股票回購規模將在 2025 年首次超過 1 萬億美元大關,主要受到美國經濟韌性,加上蘋果、英偉達、微軟以及谷歌等大型科技公司利潤強勁增長趨勢,以及美聯儲尋求降息的背景下全球金融環境的寬鬆預期相比於前兩年明顯呈樂觀態勢。
盈利預期上修也將是推動美股持續上行的重要推力。FactSet Research 彙編的華爾街分析師預期數據顯示,對於 2024 年第四季度,分析師們普遍預計標普 500 指數成分公司整體每股收益 (EPS) 將增長 15.7%,營收規模將增長 5.4%。對於整個 2025 年,分析師們預計標普 500 指數每股收益將增長 15.2%,營收有望增長 6.0%。
長期看空美股的 Evercore ISI 近日全面逆轉立場,轉向強勢看漲美股後市。該機構的策略師們預計,到 2024 年底,美國股市將再次出現兩位數級別的漲幅,標普 500 指數將創下一個又一個紀錄。Evercore ISI 首席股票和量化策略師伊曼紐爾 (Julian Emanuel) 將該機構對標普 500 指數的年底預測大幅上調至 6000 點。截至週四美股收盤,該指數收於 5543.22 點。
Evercore ISI 強調,通脹消退和科技巨頭引領的人工智能熱潮將推動美股進一步走高。“如今,人工智能在每項工作和每個行業的潛力都在發生積極變化。通脹放緩、美聯儲年內降息和經濟軟着陸預期支持着 ‘金髮姑娘’ 經濟。”
來自德意志銀行的股票策略師們也選擇看漲美股後市行情,該機構最近將標普 500 指數的年終目標點位從先前的 5100 點大幅上調至 5500 點,並且他強調該目標存在明顯的 “上行動力”。“如果市場共識預期繼續走高,並且美國經濟今年的增長再次超過預期,一些人認為這可能是美國勞動力生產率在 AI 助力下的繁榮開端,那麼不難看到標普 500 指數將達到 6000 點。” 德銀策略師們在報告中表示。
