
The U.S. stock market suffered a rough start in September! Worst first-week performance since 1953

在 2023 年 9 月第一週,美國標普 500 指數創下自 1953 年以來的最差表現,初始下跌 4.25%。這是歷史上標普 500 指數在 9 月首周表現不佳的第五次,且上週股市大幅回落,終止了此前三週的上漲趨勢。與以往類似年份相比,僅有一例月份收尾上漲,其餘年份走勢疲弱。此外,Bespoke 的研究顯示,此類情況下後續漲幅通常遠低於跌幅。
智通財經 APP 獲悉,根據 Bespoke Investment Group 的數據顯示,標普 500 指數在九月的開端表現極為慘淡,而九月本身就是美國股市歷史上較為動盪的月份之一。
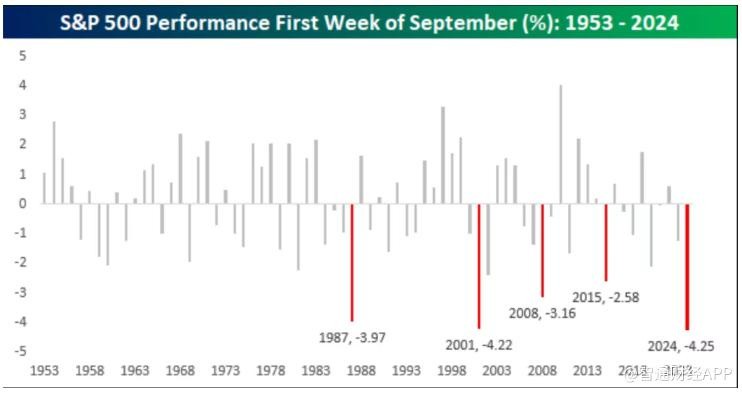
Bespoke 在週一的一份電子郵件中表示:“自 1953 年開始實行目前形式的五天交易周以來,今年九月的第一週成為標普 500 指數有史以來最差的首周表現。” 根據 FactSet 的數據,標普 500 指數在 9 月份開局下跌了 4.25%。
該公司進一步指出:“歷史上,標普 500 指數在九月首周下跌超過 2.5% 的情況只有四次發生。” 此前,九月開局最糟糕的記錄是在 2001 年,而其他幾次則分別發生在 1987 年、2008 年和 2015 年。
美國股市在上週五大幅下跌,此前發佈的就業報告低於預期。標普 500 指數和道瓊斯工業平均指數在一個因勞動節假期縮短的交易周內,均錄得自 2023 年 3 月以來的最大單週跌幅。上週的市場下跌也終止了道瓊斯指數和標普 500 指數連續三週的上漲趨勢。
Bespoke 的研究顯示,在標普 500 指數首周下跌至少 2.5% 的其他四個年份中,“該月剩餘時間的表現往往更加疲弱”,其中有三次該指數繼續下跌,僅有一次上漲。
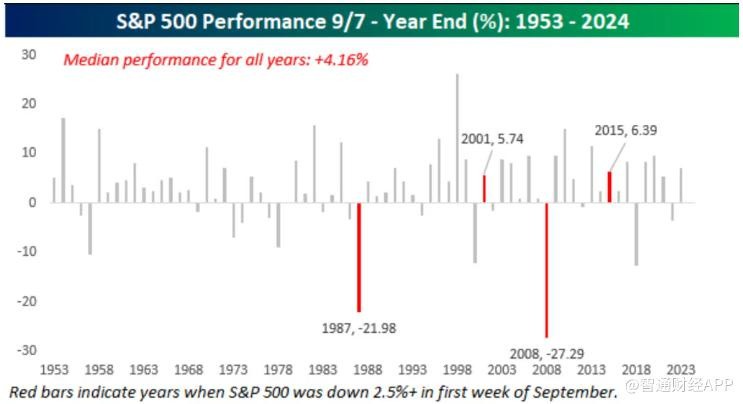
Bespoke 還研究了標普 500 指數從 9 月 7 日或該日前的最近收盤價到年底的歷史表現。其研究表明,自 1953 年以來,標普 500 指數在年內餘下時間的中位數漲幅為 4.16%,有 76% 的概率上漲。
然而,對於九月第一週下跌超過 2.5% 的四個年份,其餘下時間的表現則是漲跌各半,但上漲的幅度遠小於下跌幅度。在繼續下跌的年份裏,損失的幅度是上漲的四倍。
例如,1987 年,標普 500 指數下跌約 22%,而 2008 年則下跌超 27%。1987 年的股市崩盤發生在十月,而 2008 年 9 月雷曼兄弟的倒閉加劇了全球金融危機。
上週五標普 500 指數的下跌使其 2024 年的累計漲幅縮減至 13.4%,該指數距離 7 月 16 日創下的歷史收盤高點下降了 4.6%。
本週一,美國股市開盤上漲,從週五的大跌中反彈。根據 FactSet 的數據,截至週一上午晚些時候,標普 500 指數上漲了 0.6%,道瓊斯工業平均指數上漲了 0.9%,而納斯達克綜合指數上漲了 0.5%。
Bespoke 稱:“今天早晨的上漲缺乏明顯的推動因素,經濟數據也較為稀少。” 該公司還指出,紐約聯儲的消費者預期調查在最近幾個月中備受關注,但由於美聯儲已將重點從通脹轉向就業,該報告的影響力不如以往。
