
Candlestick patterns in K-line charts

Candlestick charts, commonly known as K-line charts, are one of the most fundamental tools in trading. Originating in Japan, they record price fluctuations through simple graphical representations, helping traders gauge market trends and sentiment.
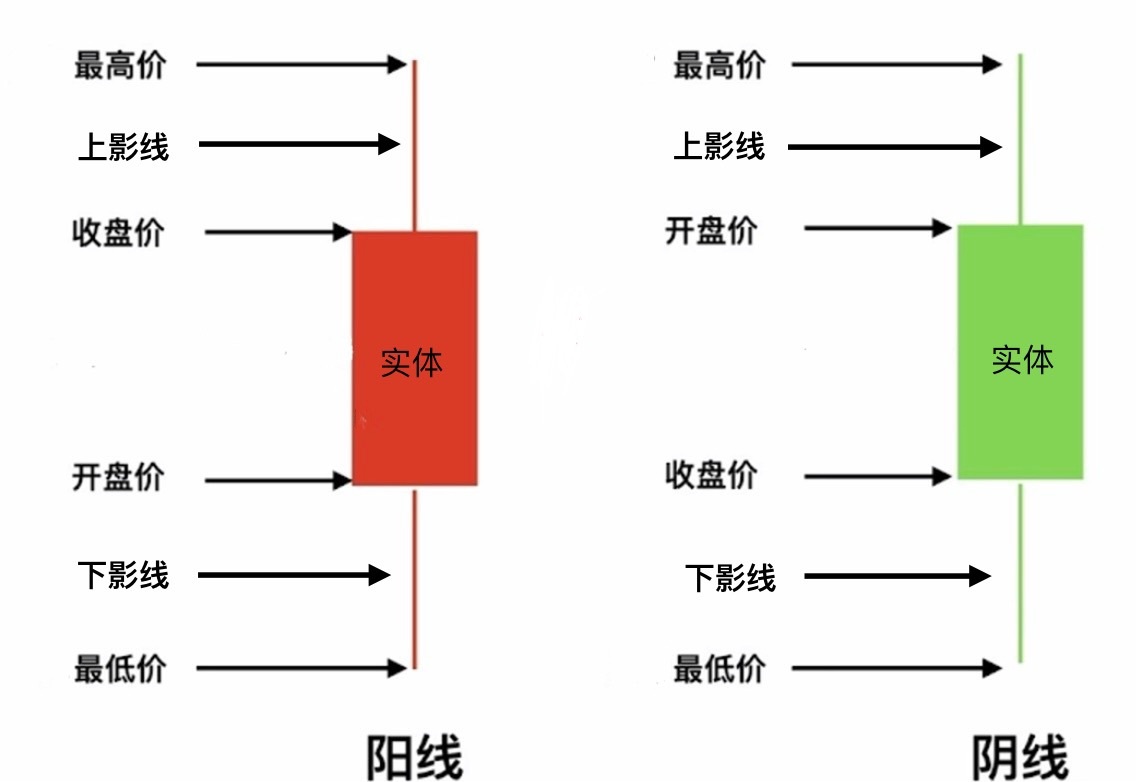
Real body: Formed by the opening and closing prices, indicating price movements. A bullish candle (closing price higher than opening price) is typically green in U.S. stocks but red in A-shares; a bearish candle (closing price lower than opening price) is usually red in U.S. stocks but green in A-shares.
Wicks: Thin lines extending above and below, representing the highest and lowest prices, respectively, reflecting the range of price fluctuations.
Single-candle implications: A long real body indicates strong trends, while a short body or a doji (where opening and closing prices are close) suggests market hesitation.
"This article is for K-line learning purposes only and does not constitute investment advice."
The copyright of this article belongs to the original author/organization.
The views expressed herein are solely those of the author and do not reflect the stance of the platform. The content is intended for investment reference purposes only and shall not be considered as investment advice. Please contact us if you have any questions or suggestions regarding the content services provided by the platform.
