
Triangle bullish flag pattern in candlestick chart

The bullish flag pattern is a common continuation pattern, usually appearing in an uptrend, suggesting that prices may continue to rise after a brief consolidation. It resembles a converging triangle, like a "flag," and serves as a signal for traders to capture trend continuation.
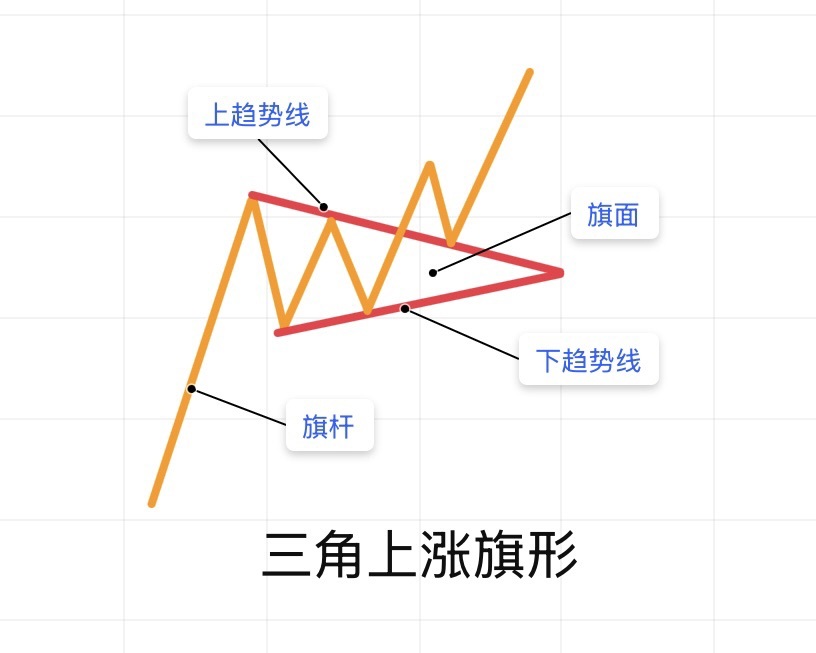
Pattern Composition:
- Flagpole: A rapid price increase in the early stage forms a steep upward segment.
- Flag: Prices experience a minor pullback at higher levels, forming two gradually converging trendlines (the upper trendline is flat or descending, while the lower trendline is ascending), creating a triangle.
- Characteristics: Volatility gradually narrows, and the consolidation period is relatively short.
Trading Signal:
When prices break above the upper trendline, it indicates that bullish forces have regained dominance, and the uptrend may continue, presenting a potential buy signal. After the breakout, the resistance of the flag often turns into support. The bullish flag pattern represents a "consolidation phase" during an uptrend, and catching the breakout point can help you ride the trend.
"This article is for educational purposes only and does not constitute investment advice."
The copyright of this article belongs to the original author/organization.
The views expressed herein are solely those of the author and do not reflect the stance of the platform. The content is intended for investment reference purposes only and shall not be considered as investment advice. Please contact us if you have any questions or suggestions regarding the content services provided by the platform.
