
Understanding the Scale of the Global Financial Markets with 20 Charts

美國銀行統計顯示,截至 2024 年 7 月,全球股票和債券的總價值為 255 萬億美元,創歷史新高。美國經濟顯示出 “金融化” 和高度的財富不平等的特點。美股在全球股票價值中所佔的份額已經達到 65%,美債佔全球債券的總數達到 44%。投資者瘋狂湧入成長型股票,美股前五大公司(微軟、蘋果、英偉達、谷歌、亞馬遜)的市值佔標普 500 總市值的 29%。
美東時間週二,美國銀行策略部門的 Michael Hartnett 及其團隊發佈報告,對全球證券市場進行了規模和範圍的評估。
Michael Hartnett 表示,目前全球的股市和債市都處於歷史高位,美國是其中最大參與者。目前,美國在全球股票價值中所佔的份額已經達到 65%,美債佔全球債券的總數達到 44%。美國經濟顯示出 “金融化” 和高度的財富不平等的特點。
當下,投資者湧入成長型股票的程度非常誇張。2024 年 7 月,美股前五大公司(微軟、蘋果、英偉達、谷歌、亞馬遜)的市值佔標普 500 總市值的 29%,科技/電信/醫療保健行業的市值佔全球股市的 45%。
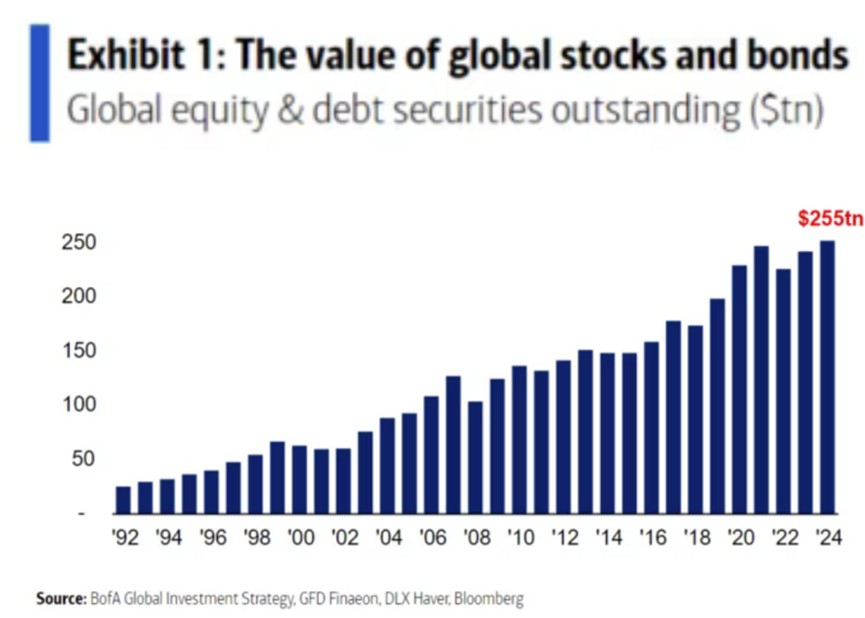
Q. 全球所有股票和債券的總價值是多少?
A. 截至 2024 年 7 月為 255 萬億美元,創歷史新高。自 2008 年 104 萬億美元的低點以來,全球股票和債券的價值已經上漲了 2.5 倍。
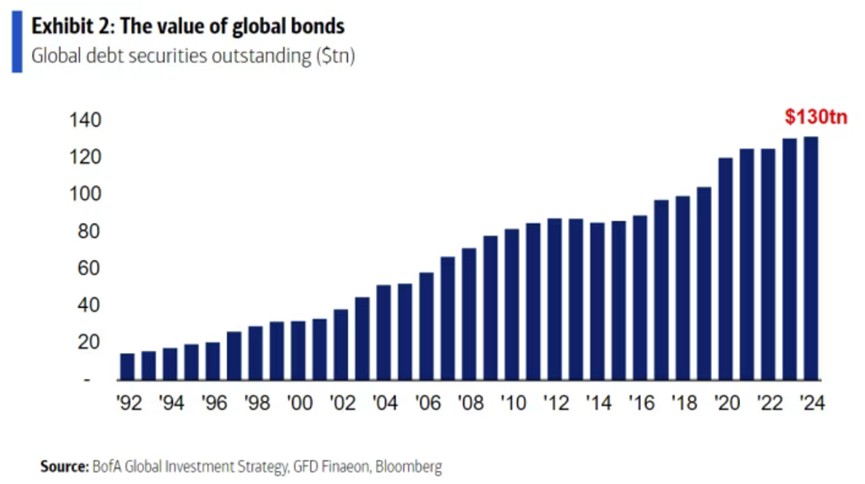
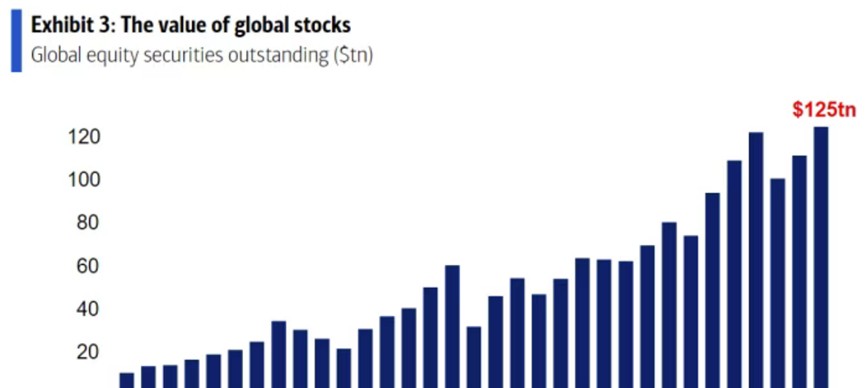
Q. 債券市場比股票市場更大嗎?
A. 是的,但兩者的差距已經縮小。自 2008 年以來,全球股票的價值翻了兩番,而債券的價值僅翻了一番。
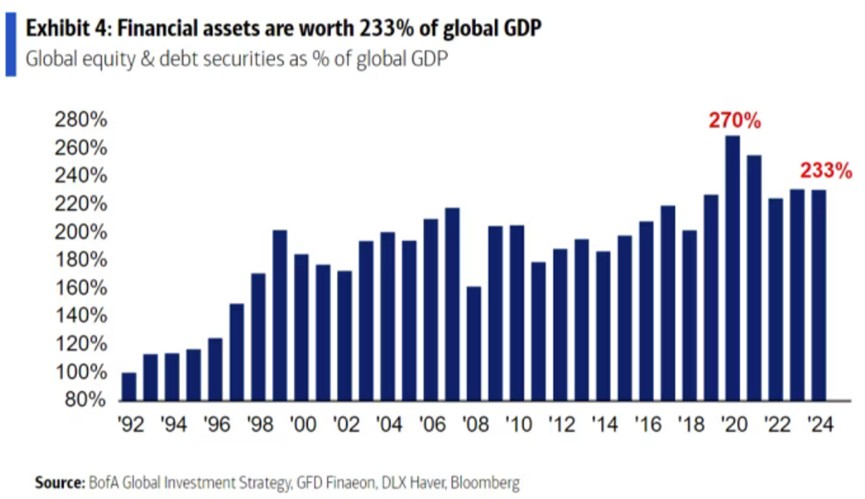
Q. 全球金融資產的價值是否超過了全球 GDP?
A. 是的,自 1992 年以來一直如此。證券對 GDP 的相對價值在 2020 年達到頂峯,為 GDP 的 270%,當時是受到了疫情經濟下降和政府政策刺激的影響。
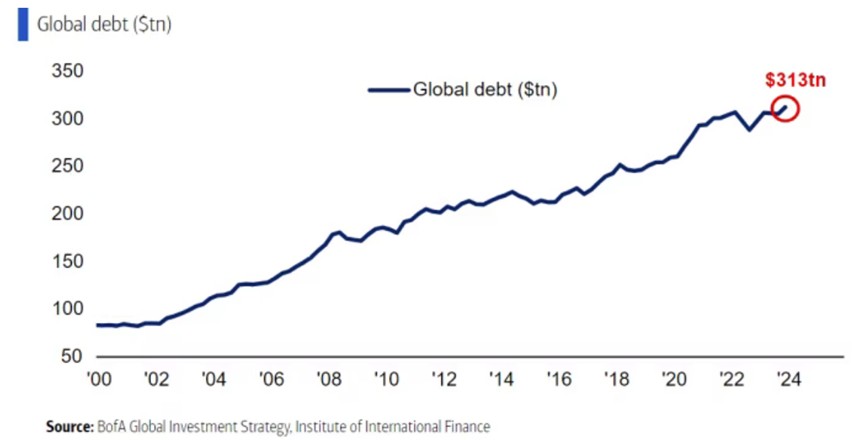
Q. 全球債務的總價值是多少?
A. 313 萬億美元,相當於全球 GDP 的三倍。如果標準普爾對行星進行信用評級,那麼地球可能會處於 BBB-,比垃圾高一個檔次。
Q. 全球債券市場中有多少債券是政府發行的?
A. 大部分都是美國政府發行的。隨着美國每 100 天增加約 1 萬億美元的借款,美債使其他所有資產都相形見絀。2008 年,美債佔全球債券總數的 28%,現在佔 44%。

Q. 全球家庭和企業債務的增長速度是否與政府借款的增長速度相似?
A. 企業借貸是的,家庭借貸不是。

Q. 能不能用一張圖來展示全球經濟從過度貨幣政策轉向過度財政政策的過程?
A. 唰唰唰印鈔。

圖例:圖中展示了全球負收益債務(Global negative yielding debt)的總額從 2010 年到 2024 年的變化趨勢。從圖中可以看到,負收益債務在 2021 年達到了峯值 17.8 萬億美元,隨後幾年急劇下降,到 2024 年幾乎為零。Michael Hartnett 表示,在過去的幾年裏,隨着負收益債務的減少,全球經濟經歷了從依賴寬鬆的貨幣政策(如低利率和量化寬鬆)轉向更多依賴財政政策(如增加政府支出和債務融資)。
Q. 美國在全球股票價值中所佔的份額最多嗎?
A. 是的,美國佔了 65%,創下了歷史新高。與此同時,歐洲和日本在全球股票價值中所佔的份額,從 2008 年的近 40%,到現在下降了一半僅佔 20%。

Q. 華爾街的總價值是否超過了主街的價值?(華爾街通常指代金融行業和大公司,特別是與股票市場、投資銀行、對沖基金、私募股權和其他金融機構相關的部分。主街通常代表普通民眾和中小企業的經濟活動,反映的是經濟中的生產、消費和就業等方面。)
A. 是的,超過很多。下方的 “華爾街” 圖表包括了除房地產以外的所有內容,包括現金存款、貸款、私募股權和養老基金儲備以及股票和債券。其當前價值略低於 2021 年 6 月創下的 6.3 倍美國 GDP 的歷史最高比率。美國私人部門金融資產自 1990 年代以來的穩步上升説明了美國經濟的 ‘金融化’ 及其高度的財富不平等。

Q. 全球股票中有多少在新興市場?
A. 按價值計算,大約五分之一。

Q. 當前投資者湧入成長型股的程度有多不尋常?
A. 對美國和全球來説都很不尋常。

Q. 美國股票被高估了嗎?
A. 可以説是的。相對於美國政府債券和公司債券,美國股票的估值處於歷史最高水平。美國政府債券相對於商品價格大幅下跌,美國股票卻保持相對穩定。


Q. 這利好比特幣嗎?
A. 是的。
