
Cui Dongshu: From January to April, China's imported cars decreased by 35% year-on-year, and the pressure of continued shrinkage on imported vehicles remains significant

Cui Dongshu pointed out that the number of imported cars in China from January to April 2025 was 135,000 units, a year-on-year decrease of 35%. In April, the number of imported cars was 40,000 units, down 22%. Since the peak of 1.43 million imported cars in 2014, imports have continued to shrink, with the total import expected to be only 700,000 units in 2024, a year-on-year decrease of 12%. Japan, Germany, and the United States are the main source countries for imports, but the number of imported cars from the United States dropped to 15,365 units from January to April 2025, a year-on-year decrease of 54%
According to the Zhitong Finance APP, Cui Dongshu, Secretary-General of the China Passenger Car Association, stated that after reaching a peak of 1.43 million imported vehicles in 2014, the number has been declining. The import growth rate stabilized slightly in 2016-2017, but has continued to decline since 2018. In 2024, the import scale is expected to sharply decrease, with only 700,000 imports for the entire year, a year-on-year decrease of 12%. Currently, from January to April 2025, 135,000 imported vehicles have been recorded, a year-on-year decrease of 35%. In April alone, 40,000 imported vehicles were recorded, down 22%. The pressure for continued shrinkage of imported vehicles remains significant.
The pressure for decline in imported vehicles in April is considerable. The top 10 countries for imports in April 2025 are: Japan 18,279 vehicles, Germany 7,864 vehicles, the United States 6,848 vehicles, the United Kingdom 2,745 vehicles, Slovakia 1,411 vehicles, Sweden 1,384 vehicles, Mexico 402 vehicles, Austria 295 vehicles, Hungary 207 vehicles, and Finland 202 vehicles. The largest year-on-year increases in April compared to last year were from Japan 1,490 vehicles, the United Kingdom 820 vehicles, Finland 187 vehicles, Spain 38 vehicles, and Thailand 29 vehicles. From January to April 2025, the highest imports were from Japan 48,790 vehicles, Germany 31,528 vehicles, Slovakia 19,144 vehicles, the United States 15,718 vehicles, the United Kingdom 11,116 vehicles, Sweden 2,730 vehicles, Mexico 1,845 vehicles, Austria 990 vehicles, Hungary 460 vehicles, and South Korea 450 vehicles. The top five countries with the largest year-on-year increases during this period are: Finland 192 vehicles, Spain 70 vehicles, Mexico 60 vehicles, Belgium 57 vehicles, and Vietnam 36 vehicles.
As China's automotive industry continues to strengthen, the electrification transformation has changed the market demand structure, leading to a continuous decline in demand for fuel vehicles, and a noticeable decrease in demand for imported fuel vehicles. The import of vehicles from the United States has rapidly declined in recent years, from an import scale of 280,000 in 2017 to 105,000 in 2024, a significant drop. From January to April 2025, imports of vehicles from the United States fell to 15,365 units, a year-on-year decrease of 54%, and the decline continued in April. With the increasing complexity of international relations, it is essential to prepare in advance to establish more complex import models to maintain a reasonable scale of imported vehicles and ensure the safety of the international supply chain.
I. Overall Trend of China's Automobile Imports
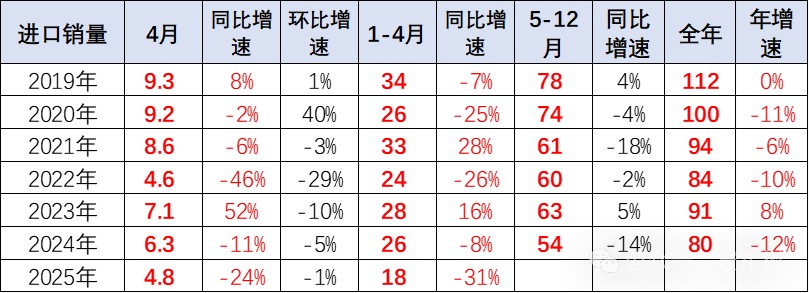
- Characteristics of Automobile Import Growth Rate
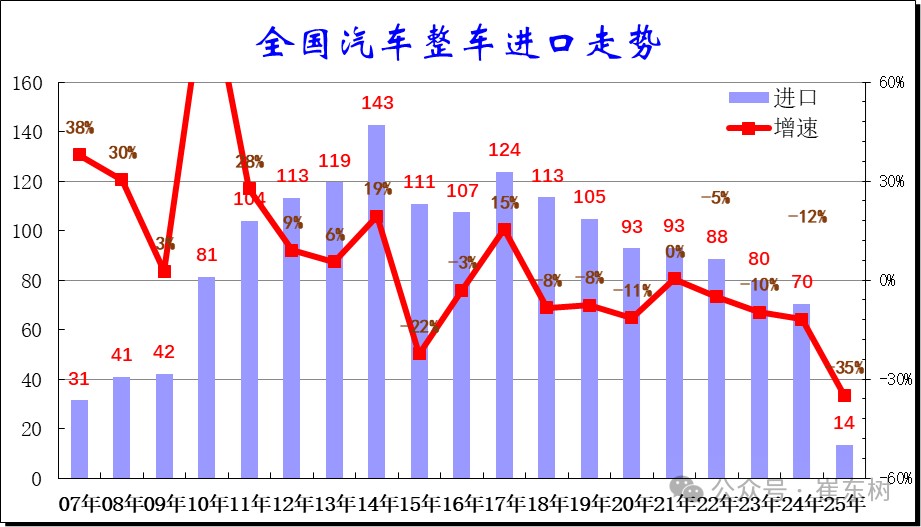
After reaching a peak of 1.43 million imported vehicles in 2014, the number has been declining. The import growth rate stabilized slightly in 2016-2017, but has continued to decline since 2018. In 2023, the import scale sharply decreased, with only 800,000 imports for the entire year, a year-on-year decrease of 10%. In 2024, the import scale continued to sharply decrease, with only 700,000 imports for the entire year, a year-on-year decrease of 12%. Currently, from January to April 2025, 135,000 imported vehicles have been recorded, a year-on-year decrease of 35%, and the pressure for continued shrinkage of imported vehicles remains significant.
 From January to April 2025, 135,000 imported cars were recorded, a year-on-year decrease of 35%, marking a significant decline for this period. In April alone, 40,000 imported vehicles were sold, down 22%. In 2024, car imports totaled 700,000 units, a year-on-year decrease of 12%. With the rise of domestic vehicles and the acceleration of international brand localization, car imports have remained sluggish in recent years, experiencing three consecutive years of negative growth; if fluctuations are smoothed out, this represents seven years of continuous negative growth.
Recently, international relations have become complex, leading to significant fluctuations in the scale of imported vehicles in 2025, with the effects of last year's overdraw still evident at the beginning of this year.
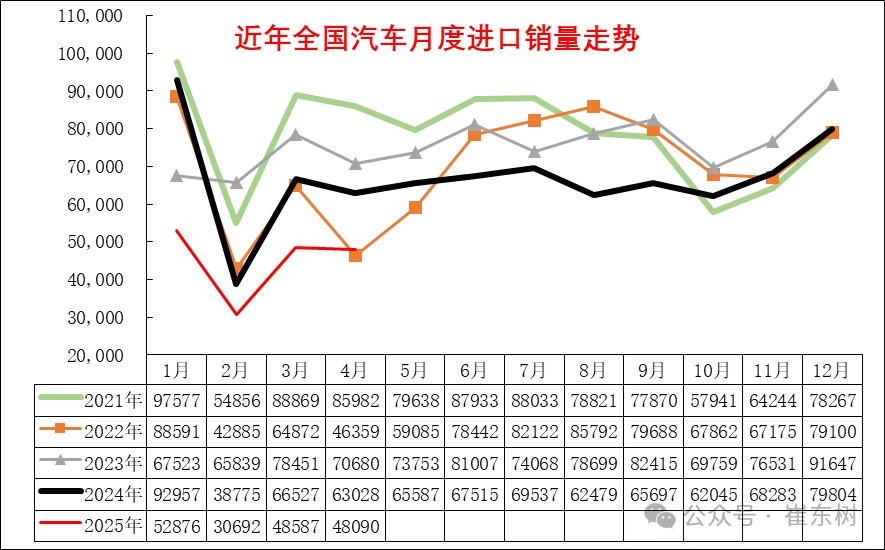
- Monthly Trends in Complete Vehicle Imports
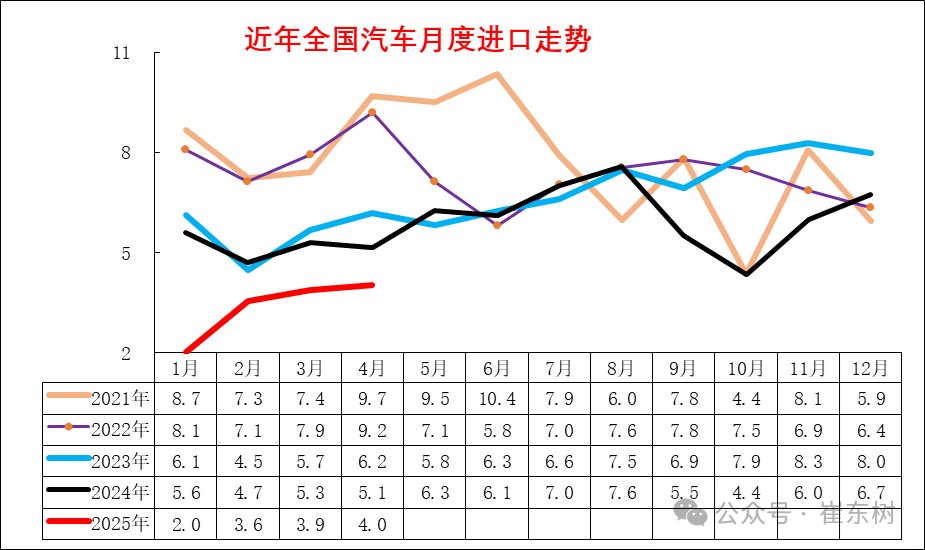
The first half of 2024 showed a normal seasonal trend, especially with a good recovery in imports from June to August. However, with the expectation of increased tariffs on imports failing to materialize, there was a sharp decline from September to November, putting significant pressure on high-end consumption, as many dealers awaited tax increases to clear inventory. The decline in imports at the beginning of the year was astonishing, primarily due to a wait-and-see approach regarding this year's downgrade situation, stabilizing somewhat after February.
- Structural Characteristics of Complete Vehicle Imports
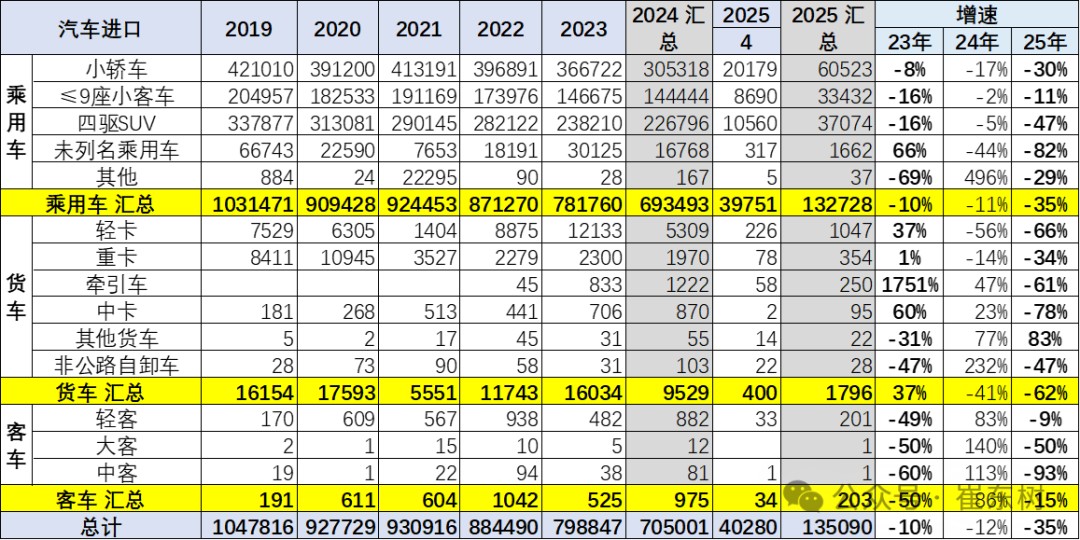
The imported vehicle market from 2017 to 2019 was relatively stable. Since 2022, all types of vehicles have seen a comprehensive decline. Traditional trucks saw a significant increase in imports in 2023, but there has been a noticeable rapid decline since then. From January to April 2025, the import of passenger cars was less than demand, and import volumes are expected to recover.
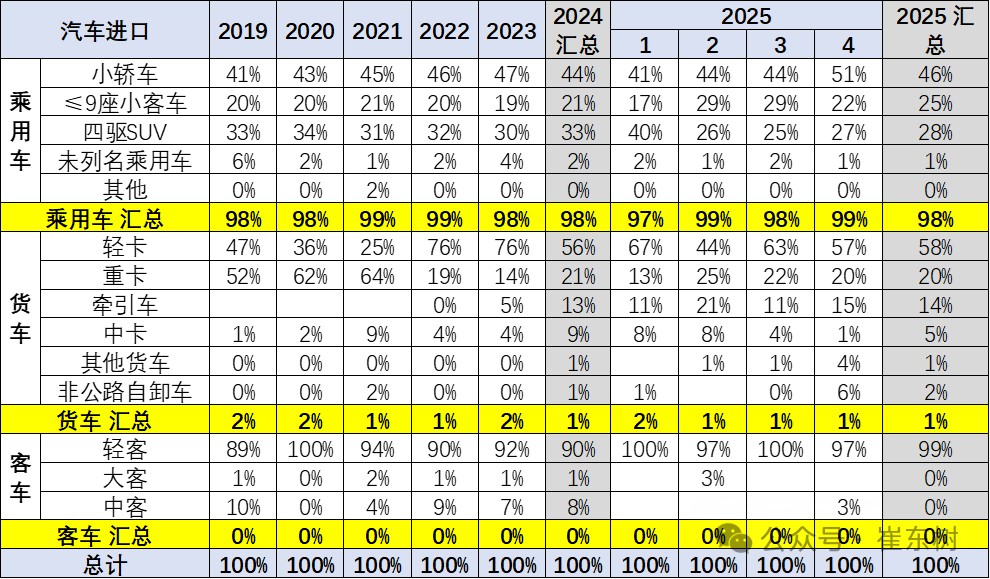
This year, passenger cars accounted for an absolute majority of 98% in the structure of imported vehicles; if light trucks including pickups are included, the proportion of passenger cars is even higher. Overall, imported vehicles are on a downward trend this year, and demand for trendy products is also weak.
Among passenger cars, from January to April 2025, imported sedans accounted for 46%; imported four-wheel drive SUVs accounted for 28%; while the import share of unnamed electric vehicles was 1%. The performance of commercial vehicle imports in 2025 has been average, especially with a significant decline in light truck imports, while imports of tractors and medium trucks are also weak. Recent imports of pickups have also been very weak.
- Structural Characteristics of Imported New Energy Vehicles
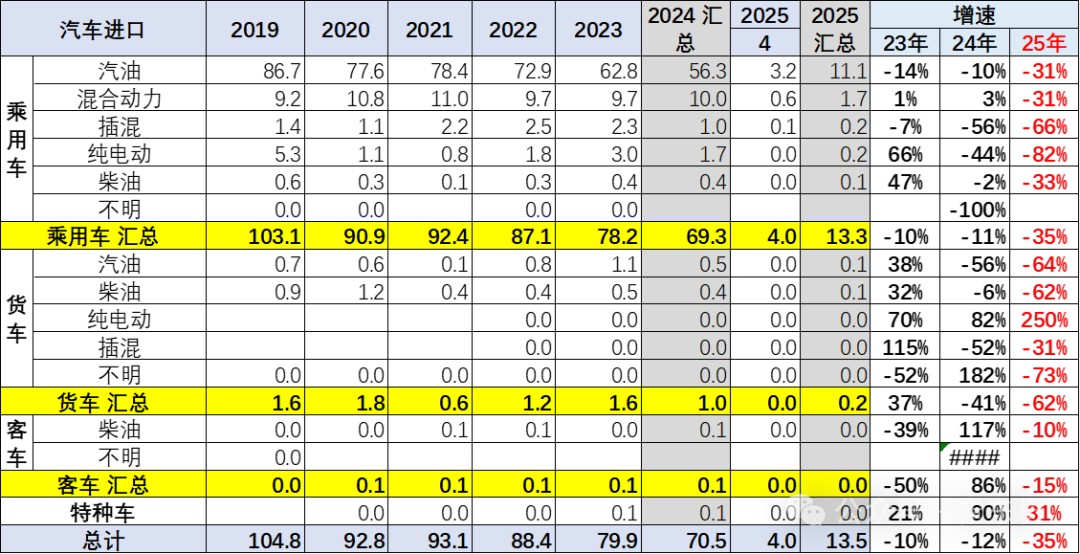
In recent years, imported new energy passenger vehicles have achieved sustained high growth, but there was a sharp decline in 2024. From January to April 2025, imports of pure electric passenger vehicles fell by 82%; Plug-in hybrids dropped by 66%, and the performance of imported new energy passenger vehicles is relatively weak.
The market for traditional fuel imported passenger vehicles has seen a significant decline, while the proportion of diesel trucks has rebounded, and the proportion of gasoline trucks has decreased, which is related to the demand for tractors.
The import performance of high-end gasoline pickups in 2025 is slow. Recently, the domestic new energy commercial vehicle market has performed relatively well, while the market for imported pure electric pickups has also performed relatively poorly.
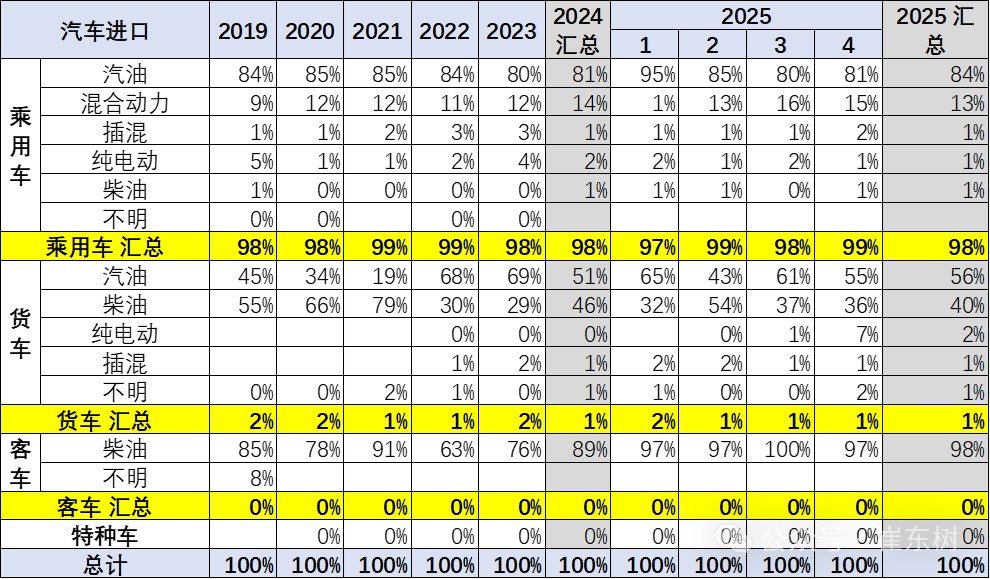
In 2024, the proportion of imported new energy passenger vehicles reached 3%, and from January to April 2025, the proportion of imported new energy vehicles decreased to 2%. The pure electric segment saw a slight decline compared to last year, while fuel passenger vehicles remain the absolute mainstay. The proportion of gasoline vehicles among trucks is still relatively high, but diesel vehicles have improved well.
- Characteristics of the displacement structure of imported passenger vehicles
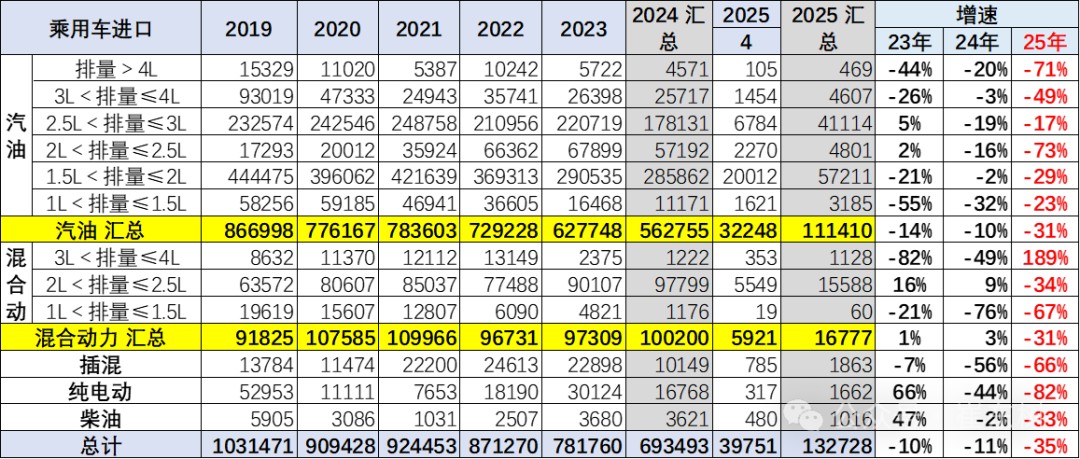
The displacement of imported passenger vehicle models is concentrated in gasoline models below 2 liters. Last year, models in the 3-4 liter range had good resilience, while this year, the 2.5-3 liter range performed well.
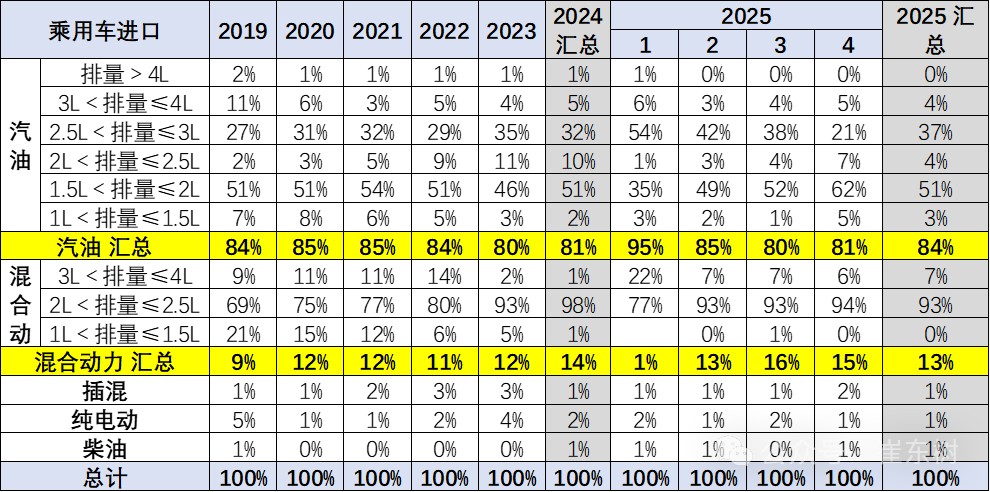
The displacement of imported passenger vehicle models was originally concentrated in gasoline models below 2 liters, with the proportion of imports in the 1-4 months of 2025 accounting for 54% of the total gasoline vehicle imports, an increase of 1 percentage point compared to last year.
High-end large-displacement models are declining slightly slower. In recent years, the sales of large-displacement imported vehicles in the 2.5-3 liter range have declined slowly, and their proportion has increased. Due to the domestic market primarily featuring models below 2 liters, the imported 2.5-3 liter models face relatively little competitive pressure.
II. Automotive Import Market Structure
- Import characteristics by country
The countries from which China imports passenger vehicles are still centered around Japan, Germany, Slovakia, and the United States, with significant recent growth in imports from Slovakia and increased pressure on imports from the United States.
- Monthly trends in complete vehicle imports
 In April, the pressure on imported cars declined significantly. The top 10 countries for imported cars in April 2025 are: Japan 18,279 units, Germany 7,864 units, the United States 6,848 units, the United Kingdom 2,745 units, Slovakia 1,411 units, Sweden 1,384 units, Mexico 402 units, Austria 295 units, Hungary 207 units, and Finland 202 units. The largest year-on-year increases in April compared to last year were from Japan 1,490 units, the United Kingdom 820 units, Finland 187 units, Spain 38 units, and Thailand 29 units.
From January to April 2025, the highest imports were from Japan 48,790 units, Germany 31,528 units, Slovakia 19,144 units, the United States 15,718 units, the United Kingdom 11,116 units, Sweden 2,730 units, Mexico 1,845 units, Austria 990 units, Hungary 460 units, and South Korea 450 units. Among these, the top five countries with the largest increase compared to the same period last year are: Finland 192 units, Spain 70 units, Mexico 60 units, Belgium 57 units, and Vietnam 36 units.
- Characteristics of Imported New Energy Vehicles by Country
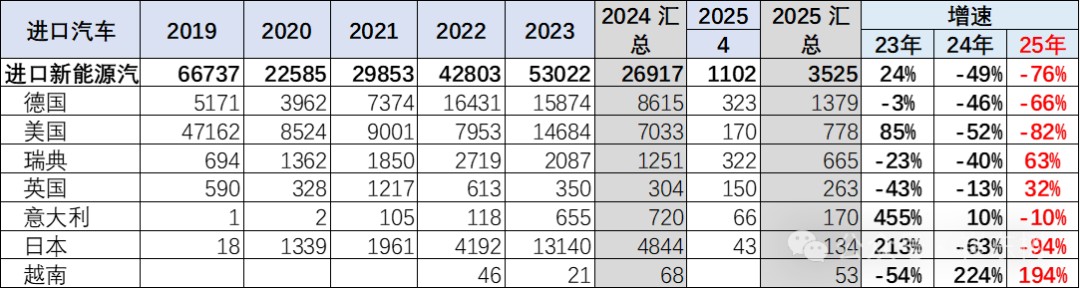
Before 2019, the import quantity of new energy vehicles was large, but in 2021, the domestic production of Tesla led to a significant decline in pure electric vehicles.
In 2021, the pure electric vehicle market was greatly affected by the domestic production of Tesla, but from 2022 to 2023, the development of new energy was strong, allowing more companies to import new energy vehicles.
In 2024, domestic vehicles became more competitive, and imports from major countries for new energy vehicles declined by half. The pressure on imported new energy passenger vehicles in 2025 further increased, with some sales remaining for European imports of new energy.
3. Sales Pattern of the Automotive Market
- Overall Sales of Imported Vehicles
In previous years, imported vehicles maintained a high sales volume of nearly 70,000 units in April, but this year, the sales trend of imported vehicles has sharply declined, with only 48,000 units sold in April. The Spring Festival factor led to weak demand in January, and the recovery in March and April was slow, indicating that future imports may be more cautious.
Due to the strength of Chinese domestic car manufacturers, the sales performance of imported vehicles has continued to decline and is weaker than that of domestically produced luxury vehicles. In 2021, the sales of imported vehicles reached 940,000 units, a decrease of 6% compared to 2020.
In 2022, the sales of imported vehicles were 840,000 units, a significant decrease of 10% compared to 2021, and also relatively weak compared to domestic vehicles. In 2023, there was finally a return to positive growth, reaching 910,000 units, an increase of 8% The data for mandatory traffic insurance for imported cars in 2024 is 800,000 units, a year-on-year decrease of 12%. Due to the impact of a high base at the beginning of 2024, the retail sales of imported cars from January to April this year have seen a significant decline of 31%, with April dropping to 24%. The pressure remains high for the future.
- Characteristics of Imported Car Brands
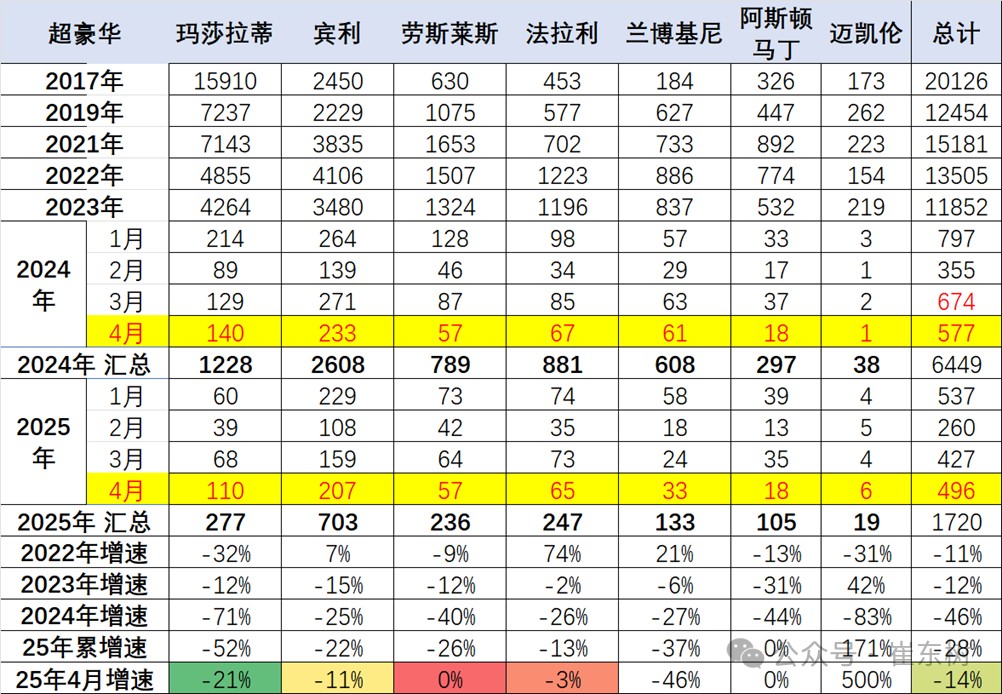
In recent years, the imported super luxury car segment has continued to grow, but there has been a significant decline since 2023, accelerating in 2024, with a strong decline still observed from January to April 2025. Ferrari's performance is strong. Bentley and Rolls-Royce have shown relatively stable performance, although they have been declining consecutively, they still maintain relatively high sales. Maserati's performance has been generally sluggish, and the overall super luxury segment is weakening, reflecting a temporary slowdown in the purchasing power of the ultra-high-end consumer group, but high-end Ferrari models performed well from January to April 2025.
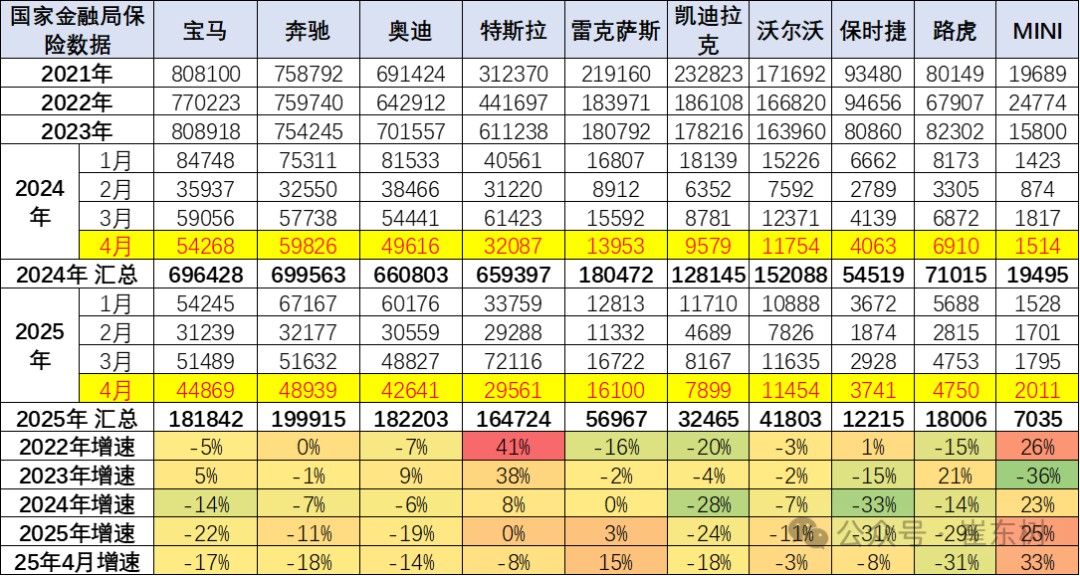
Currently, the demand for imported cars mainly relies on luxury vehicles, while non-luxury imported cars are experiencing severe shrinkage. The proportion of imported luxury cars among imported vehicles has significantly increased. Lexus's retail performance in imports for 2025 is good. BMW, Audi, and Land Rover have shown overall strong performance, while Porsche's recent performance has been relatively weak.
Joint venture brand imported cars are rapidly shrinking, with Toyota, Volkswagen, Subaru, and some other brands experiencing severe declines in imports.
- Regional Changes in Imported Super Luxury Car Brands
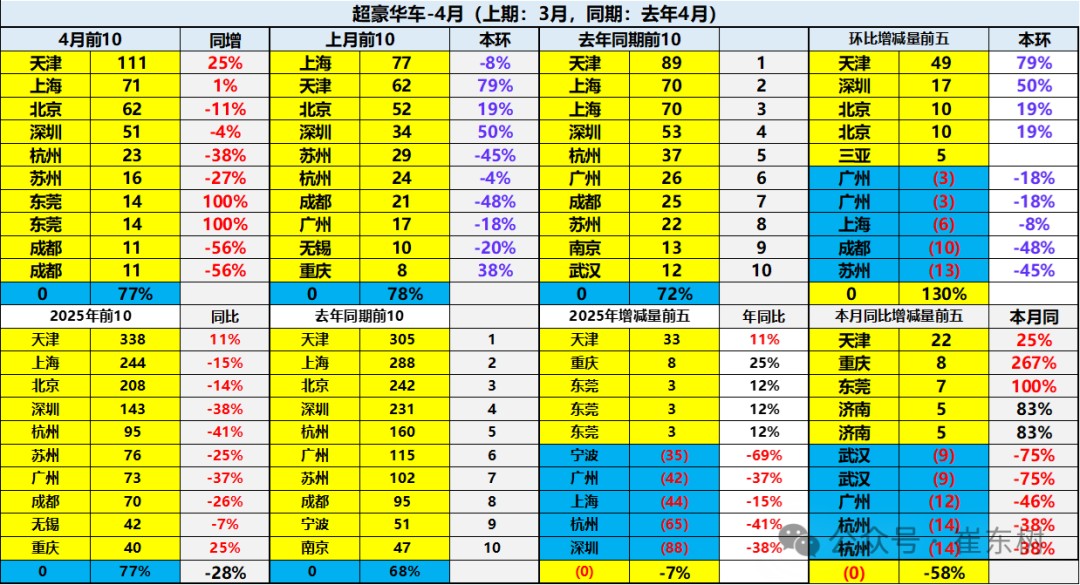
The overall demand in the imported car market is relatively weak, with Tianjin surpassing Shanghai to become the leader in super luxury cars. The imported super luxury car market in traditional affluent areas such as Shanghai, Shenzhen, Beijing, and Chengdu is under significant pressure. The impact of new energy vehicles on super luxury cars is minimal, as wealthy consumers seek to showcase their status, and brands like Ferrari continue to perform well. Due to the high-end business and identity characteristics of super luxury cars, the overall market demand is poor.
- Regional Changes in Luxury Cars
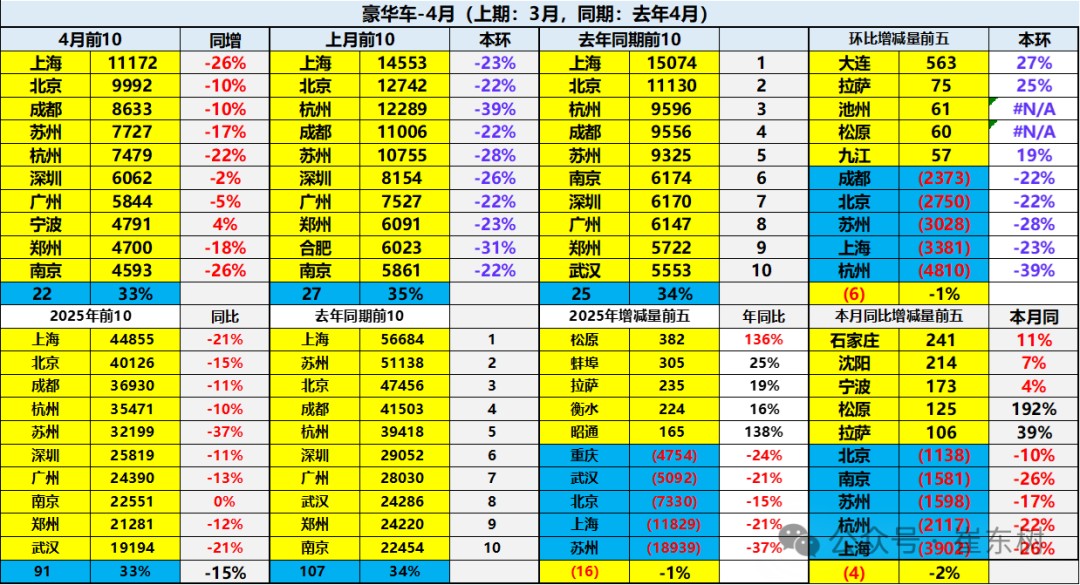
Overall, the demand in the domestic and imported luxury car market is relatively weak, with significant pressure in the luxury car markets of traditional affluent areas such as Shanghai, Shenzhen, Beijing, and Chongqing. This year's performance in cities like Suzhou and Shanghai has been average
