
ETH price update – $3.4K in sight if THIS Ethereum support fails!

以太坊的價格前景依然謹慎,因為它面臨着 3,900 美元至 4,000 美元的關鍵支撐。如果跌破這一水平,可能會回撤至 3,400 美元。關鍵阻力位在 4,250 美元和 4,472 美元,市場結構的看漲趨勢依賴於突破 4,755 美元。儘管存在看漲的波動結構和積極的開發者活動,但 OBV 和 RSI 跌破 50 的警示信號表明需求減緩。建議投資者密切關注 4,000 美元的支撐,因為如果周線收盤低於 3,712 美元,可能會表明更強的看跌動能
關鍵要點
短期以太坊前景如何?
1 天的圖表顯示,$3.9k-$4k 是一個重要的支撐區間,必須守住以保持復甦的希望。
上方的關鍵阻力位是什麼?
$4,250 和$4,472 是斐波那契回撤水平。$4,755 是一個局部高點,必須突破才能將市場結構轉為看漲。
以太坊 [ETH] 生態系統在 2025 年的新開發者和活躍開發者統計中佔據主導地位,Solana [SOL] 排名第二。根據最近的 AMBCrypto 報告,它們之間的相關性也很緊密。
以太坊從交易所的流出也增強了投資者的信心。Binance 上的 ETH 交易所供應比率為 0.033,表明投資者正在將其代幣轉入自我保管。這是多個月來的低點。
結合不丹國家數字身份基於以太坊網絡的消息,投資者有理由保持看漲的前景。價格圖表顯示以太坊接下來的走勢如何?
以太坊多頭不應忽視這些警告信號
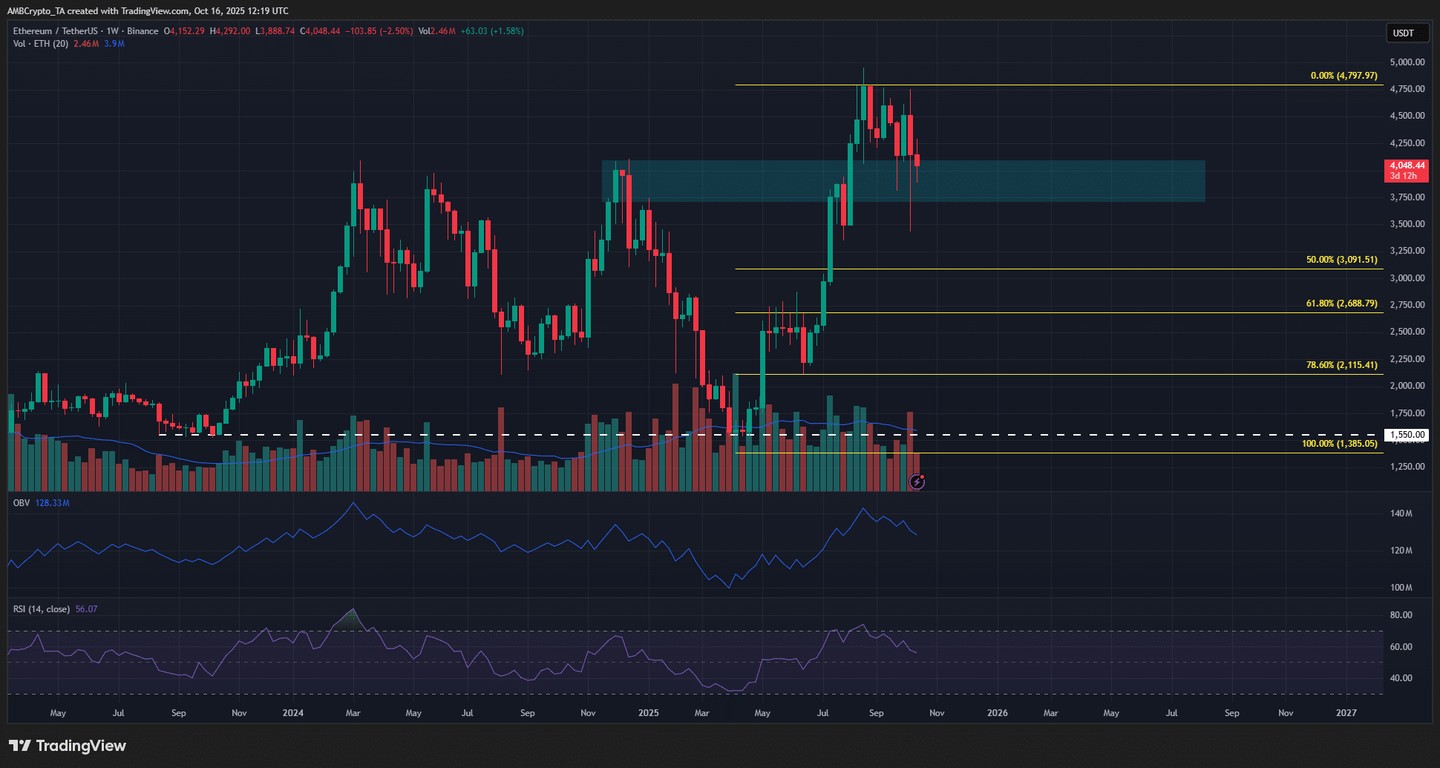
來源:TradingView 上的 ETH/USDT
周線時間框架顯示出看漲的擺動結構。斐波那契回撤水平是基於從$1,385 到$4,798 的擺動移動繪製的。在撰寫時,標記為青色的$4k 看漲破壞塊正在充當需求區。
然而,儘管周線價格尚未收於$4k 以下,OBV 已跌破 2024 年 12 月的高點。這對投資者來説是一個警告信號,表明近期需求減緩。RSI 也保持在中性 50 以下。
展望未來,若周線收盤低於$3,712 將是一個令人擔憂的信號,因為這表明空頭足夠強大,能夠將價格回撤至$3.1k。
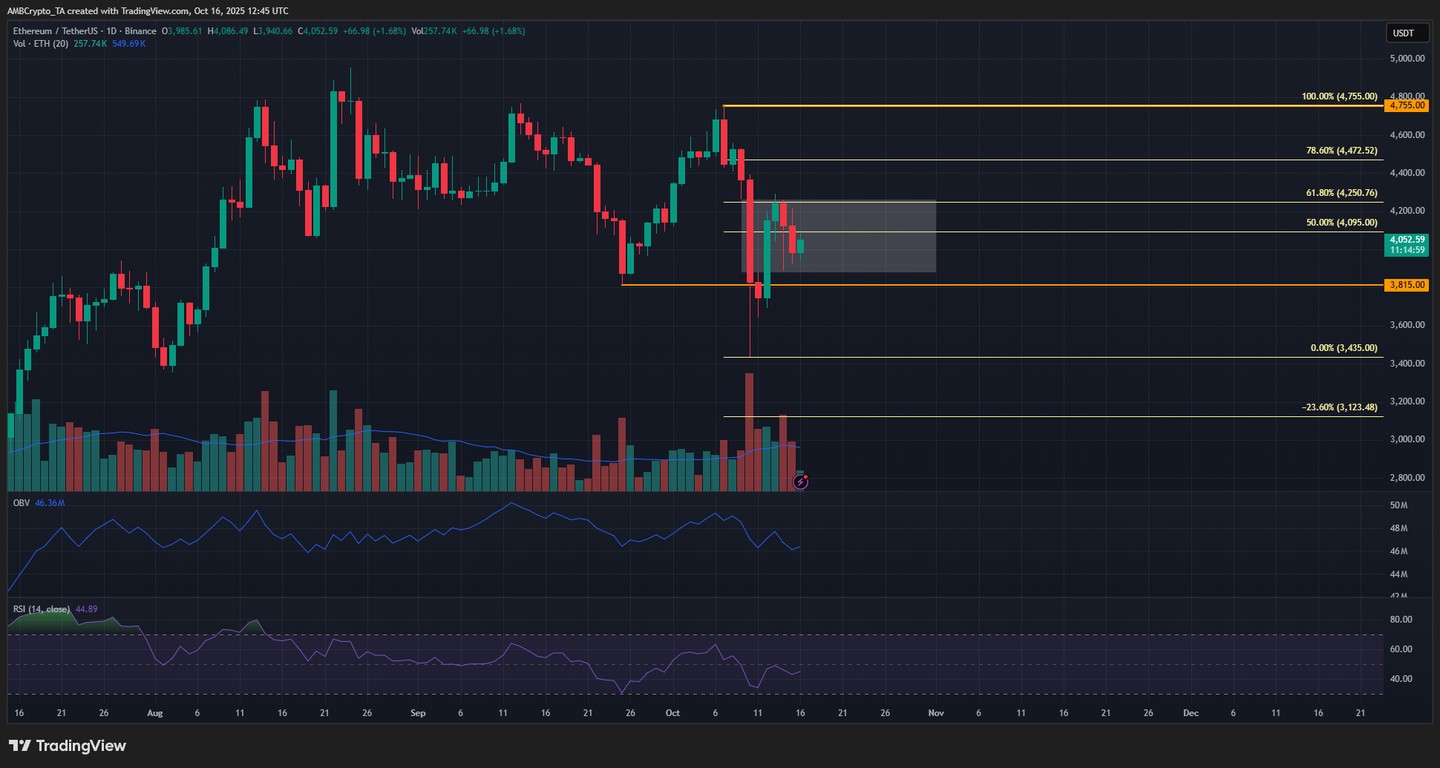
來源:TradingView 上的 ETH/USDT
在日線圖上,市場結構在跌破$3,815 後變得看跌。$4.2(白色框)處的失衡已被填補。
$4,250 水平代表以太坊最近下行衝動的 61.8% 斐波那契回撤。
因此,以太坊多頭在接下來的幾天可能會在推動價格突破$4.2k–$4.4k 的阻力區間方面遇到困難。然而,這一努力取決於他們能否在$4,000 的關鍵心理水平上保持支撐。
若跌破$3.9k,ETH 可能在接下來的一兩週內回撤至$3.4k。
