
Bank of America: Rising market volatility indicates that a bubble is forming, but it is still in the early stages
Bank of America pointed out that the market has recently seen a phenomenon of rising stock prices and increasing volatility, indicating the early formation of asset bubbles, especially those driven by artificial intelligence. Although the current VIX index is still near the historical median, the market still has further upside potential. Bank of America recommends that investors participate in the subsequent rise through options and other tools to control risks and obtain returns
Bank of America stated that the market has recently seen a scenario of "rising stock prices and increasing volatility," which is an early sign of asset bubbles. However, this round of AI-driven bubble may still have a long way to go in its expansion process.
On November 5th, according to news from the Wind Trading Desk, BofA Global Research reported that the U.S. stock market has frequently seen simultaneous increases in VIX futures and the S&P 500 index. This combination of "rising stock prices and increasing volatility" has historically been a hallmark of asset bubbles.
However, the team led by strategist Benjamin Bowler noted that, unlike the late stages of historical bubbles, the current VIX index remains near its historical median, and the index's realized volatility is relatively mild, indicating that both the market and volatility itself still have room for further upward movement.
Analysis suggests that the main risk in the current market (pain trade) is missing out on the upward trend rather than a deep correction. However, given the Federal Reserve's hawkish signals and macroeconomic uncertainties, the risk of a correction also exists. Therefore, Bank of America advises investors not to completely exit the market but to participate in the subsequent upward trend through options and other asymmetric tools to achieve leveraged gains while controlling risk.
"Stock Prices and Volatility Rising Together": A Clear Signal of Bubble
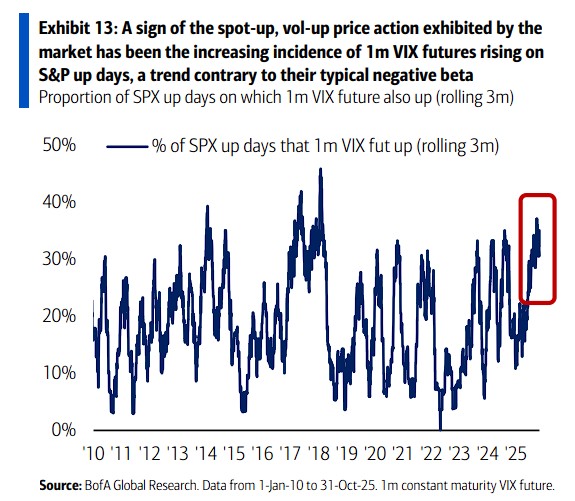
The report states that the "calm" price movements seen in the summer market seem to have been disrupted. A significant change is that the U.S. stock market has recently seen an increasing frequency of simultaneous rises in the S&P 500 index and VIX panic index futures.
This is in stark contrast to the usual negative correlation between the two. Historically, this dynamic of "spot-up, vol-up" is a hallmark signal in the formation of asset bubbles.
At the same time, the vulnerability at the individual stock level is sharply increasing, especially among large tech stocks. The report cites the recent earnings season as an example:
Meta's stock price plummeted 11.3% on October 30, with its daily volatility being about 8.3 times its past realized volatility.
Amazon surged 9.6% on October 31, with its volatility being about 5.5 times its past realized volatility.
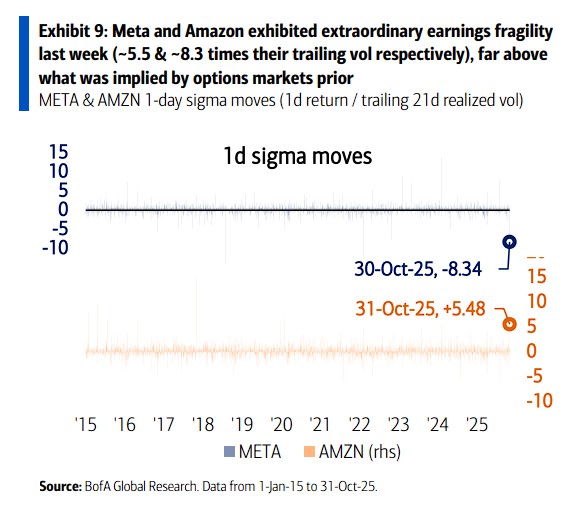
The report points out that these extreme fluctuations far exceed the prior expectations of the options market. Data shows that from 2025 to the present, the frequency and magnitude of significant fluctuations (daily price changes exceeding 3 standard deviations) in U.S. tech stocks have reached historical highs, even surpassing the dotcom bubble period. This indicates that, despite the steady rise of the index, there have long been undercurrents at the individual stock level Bank of America clearly stated in the report that this abnormal phenomenon is a hallmark of market bubbles accumulating, which has been seen throughout history. When market sentiment is high, and investors chase upward momentum while simultaneously buying options for hedging or speculation, this positive correlation may occur.
Why is it said that the bubble is still in its early stages?
Although signals of a bubble have emerged, Bank of America emphasizes that we may still be in the early stages of the bubble. The main basis for this comes from several key volatility indicators:
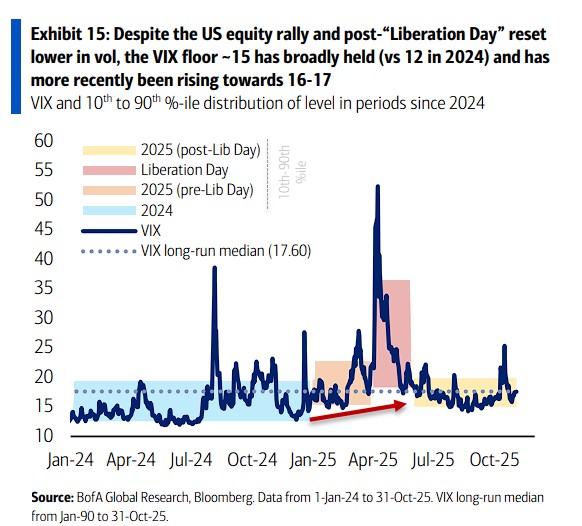
VIX index level is not extreme: Although the bottom of the VIX index has risen from around 12 in 2024 to about 15, the current level is still close to its long-term median of 17.60. This is far from the state of the VIX soaring above 40 during the late stages of the internet bubble.
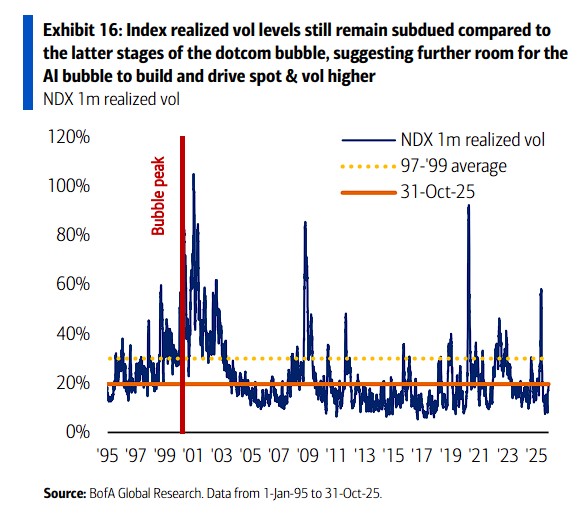
Realized volatility is relatively controlled: The report specifically points out that the 1-month realized volatility of the Nasdaq 100 Index (NDX) is still "quite mild" compared to the levels during the peak of the internet bubble. At the peak of the bubble in late 1999, the average realized volatility of the NDX reached as high as 93%, while the current level is far below this.
Overall, these "mild" indicators suggest that the current AI bubble may still have considerable room for development before the market reaches the peak of "irrational exuberance" and ultimately bursts. As stated in the bank's research report:
"Although the simultaneous rise of stock prices and volatility has historically been a hallmark of market bubbles... the current level of realized volatility in the index remains mild (especially compared to the tech bubble period), indicating that before the eventual burst, stock prices and volatility may still have further upside potential. This is consistent with our broader bubble framework analysis."
Based on the judgment that "the AI bubble will continue to expand," and considering that the risk of a pullback always exists, Bank of America suggests that investors use options for asymmetric positioning in the report. Specific strategies include:
Selling VIX put options to construct zero-cost S&P 500 call spreads, utilizing the solid bottom of the VIX to reduce the cost of gaining upside returns;
And from a longer-term perspective, buying up-variance on the S&P 500 to directly go long on delta and volatility, capturing the long-term expansion process of the bubble.
The above wonderful content comes from the Wind Trading Platform
For more detailed interpretations, including real-time analysis and frontline research, please join the【 **Chasing Wind Trading Platform ▪ Annual Membership**】

Risk Warning and Disclaimer
The market has risks, and investment requires caution. This article does not constitute personal investment advice and does not take into account the specific investment goals, financial situation, or needs of individual users. Users should consider whether any opinions, views, or conclusions in this article are suitable for their specific circumstances. Investment based on this is at one's own risk