
End-of-2025 sprint! Hedge fund net leverage soars to a high of 99%, aggressively increasing positions in global stock markets for 7 consecutive weeks, with U.S. stocks taking the majority
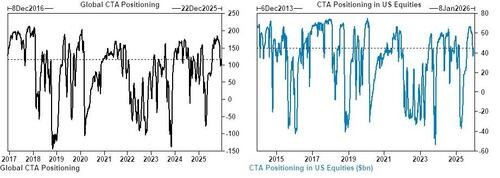
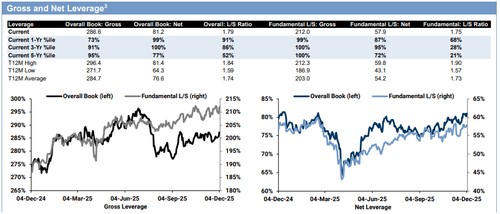
距離 2025 年結束僅剩 16 個交易日,對沖基金連續第七週淨買入全球股票,CTA 策略基金已從淨賣方轉為買方,高盛模型顯示本週買入 90 億美元全球股票,整體敞口升至 1100 億美元。根據高盛 Prime Brokerage 數據,對沖基金總賬面槓桿率上升 1.5% 至 286.6%;淨槓桿率增加 0.4 個百分點至 81.2%,達到一年來 99 分位數水平。除亞洲新興市場外,所有主要地區均被淨買入,北美地區領漲。
距離 2025 年結束僅剩 16 個交易日,標普 500 指數距離歷史收盤紀錄僅差 30 個基點,多重市場力量正在重塑投資格局。本週三美聯儲議息會議成為焦點,市場共識已從"不太可能降息"轉向"100% 概率降息",再到預期"鷹派降息"。
根據高盛 Prime Brokerage 數據,對沖基金連續第七週淨買入全球股票,其中做多買盤超過做空賣出的比例為 1.3 比 1。CTA 策略基金已從淨賣方轉為買方,高盛模型顯示本週買入 90 億美元全球股票,整體敞口升至 1100 億美元。企業回購活動異常活躍,交易量較 2024 年同期日均水平高出 80%。
板塊輪動顯著,資金從防禦性板塊流出轉向週期性股票。公用事業跌 4.83%,房地產投資信託基金下跌 2.58%,而週期性股票相對防禦性股票上漲 5.01%。量子計算概念股五日漲幅達 14.61%,非盈利科技股上漲 9.61%。
對沖基金持續增倉全球股票
根據高盛 Prime Brokerage 數據,對沖基金總賬面槓桿率上升 1.5% 至 286.6%;淨槓桿率增加 0.4 個百分點至 81.2%,達到一年來 99 分位數水平。基本面多空策略淨槓桿率為 57.9%,處於一年來 87 分位數。
除亞洲新興市場外,所有主要地區均被淨買入,北美地區領漲。個股連續第七週被淨買入,過去 13 週中有 12 周錄得淨流入。金融、醫療保健和通信服務成為全球淨買入最多的板塊,消費非必需品、消費必需品和公用事業則遭淨賣出。
歐洲市場呈現風險偏好回升跡象,新增多頭倉位超過新增空頭。高盛賬面上歐洲在 MSCI 全球指數中的超配比例為 1.44%,較前一週下降 0.35 個百分點,北美仍維持 9.42% 的低配。
CTA 策略轉向全面買入
高盛模型顯示,CTA 策略基金在各種市場情形下均將成為買方。未來一週內,平盤情形下預計買入 298 億美元,上漲情形下買入 312 億美元,僅在下跌情形下賣出 29 億美元。
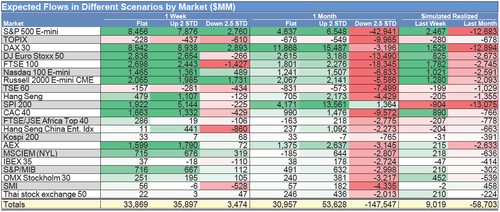
關鍵技術位方面,標普 500 短期觸發位在 6754 點,中期重要觸發位在 6512 點,長期支撐位在 6070 點。模型預測這些策略將在未來幾天內達到目標敞口水平。
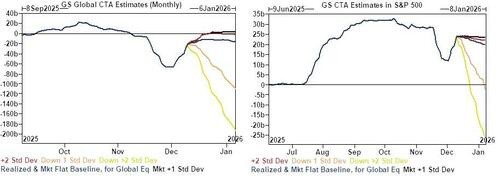
值得注意的是,平盤市場情形下一週和一個月的預期部署資金基本相同,表明 CTA 策略可能很快達到均衡狀態。
企業回購與 IPO 供需格局
企業回購活動進入高峰期。高盛回購交易台數據顯示,截至 11 月 21 日當週交易量較 2024 年同期日均水平高出 80%,較 2023 年同期高出 100%,主要集中在金融、消費非必需品和科技板塊。
當前正值企業開放窗口期高峰,公司積極通過回購應對市場疲軟,預計這一開放窗口將持續至 12 月 19 日。通常第四季度回購活動會顯著增加,因為企業尋求完成年度回購目標。
IPO 方面,本週北美地區新發行和增發規模達 99.5 億美元,年初至今累計 3902 億美元。供需格局繼續有利於股價支撐。
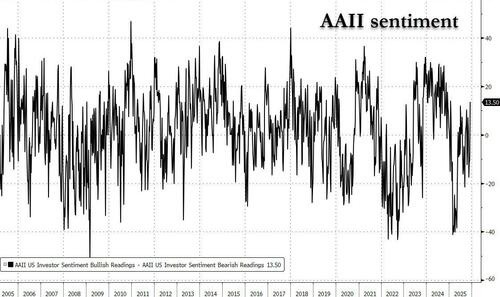
投資者情緒指標回暖
散户投資者情緒顯著改善。AAII 情緒調查顯示,截至 12 月 3 日當週,多空差值反彈至年內第二高水平。看漲比例上升 12.3 個百分點至 44.3%,看跌比例下降 11.9 個百分點至 30.8%。
CNN 恐慌與貪婪指數從一週前的 18 升至 40,為 10 月底以來最高水平。高盛情緒指標從此前幾個月的負值區間回升至中性區域,最新讀數為 +0.1。
共同基金流入有所放緩但仍保持正值,全球股票基金淨流入 80 億美元,低於前一週的 180 億美元。科技板塊基金流入轉為負值,而英國股票基金在預算案發布後轉為淨流入。
