
Daniel Zhang talks about gold: When "fantasy" enters "reality"

Against the backdrop of global security and order reconstruction, the Danish pension fund has exited U.S. Treasury bonds, and Canadian Prime Minister Carney is visiting China. The report "Gold: A Century, A Decade, Next Year" indicates that gold may rise due to changes in the global economy, politics, and military situation. Concerns in emerging markets about the dollar-dominated system have prompted them to increase their gold reserves, with significant increases in gold purchases by China and India in 2024, potentially leading to a rise in global gold demand
Preface
As the United States attacks Venezuela and covets Greenland, the Danish pension fund announces its withdrawal from the U.S. Treasury market, and Canadian Prime Minister Carney states during his visit to China that he is prepared to welcome a "new world order"... In today's world, "security," "tearing," and "order" are under constant scrutiny, the old order is gradually declining, while establishing a new order remains fraught with challenges.
As we pointed out in our report "Gold: A Century, A Decade, Next Year" released in December 2023, "As long as any changes in order, economy, politics, or military escalate, gold may have new logic, and the strategic trend is bullish"; in March 2025, we reiterated in our report "Gold 'Rhapsody' - Price Simulation Under Five Extreme Scenarios": "The path of global order reconstruction remains low in visibility, and in the medium term (5-10 years), strategic attention to the upward pulse of gold is necessary," and we imagined five extreme scenarios: increased reserves in emerging markets, collapse of crypto assets, changes in reserve currencies, escalation of geopolitical conflicts, and the revival of the global gold standard.
In less than a year, the initial "fantasy" is gradually becoming today's "reality," continuously validating the ideas in our report. We once again recommend and reissue this report from eight months ago to provide more inspiration for investors:
"Gold 'Rhapsody' - Price Simulation Under Five Extreme Scenarios" (March 31, 2025)
Report Summary
Extreme Scenario One: Increased Reserves in Emerging Markets
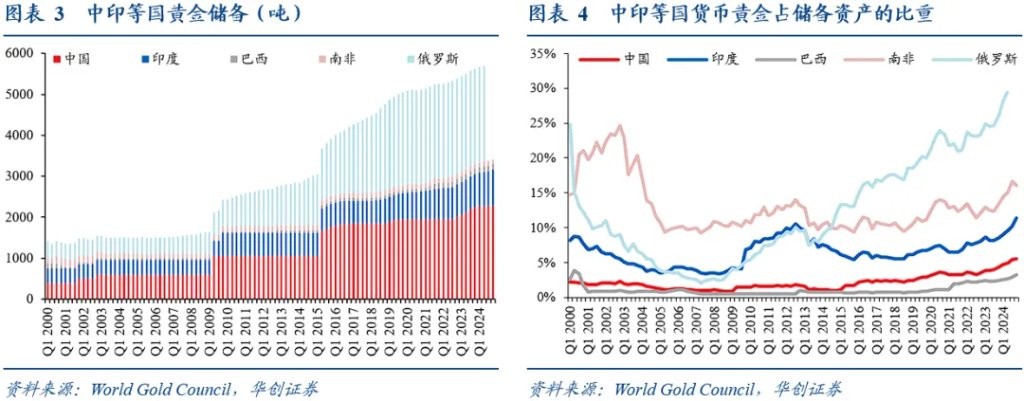
The current U.S. dollar-dominated global monetary system is showing signs of cracks: first, there are concerns in global emerging markets about the sustainability of U.S. debt; second, the catalyst of the Russia-Ukraine conflict has triggered worries in emerging markets about frozen dollar assets. Currently, there are signs of a systematic restructuring of foreign exchange reserves in global emerging markets: China's gold purchases in 2024 will reach 44 tons, accounting for 13.2% of global central bank net demand; the proportion of gold reserves held by the Reserve Bank of India is also rapidly increasing, rising from 8.09% to 11.35% in just two years; in 2024, the central bank with the highest gold purchases globally is Poland (90 tons).
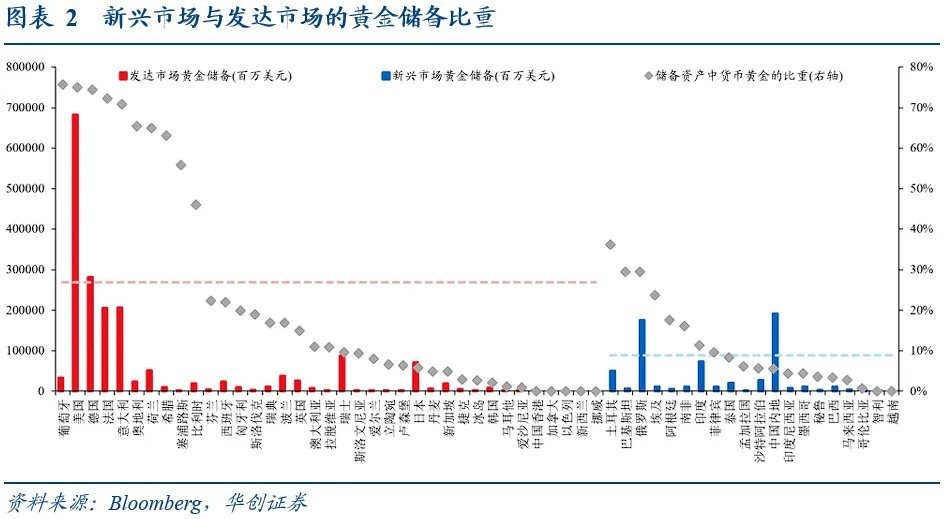
The proportion of monetary gold in the reserve assets of major emerging markets globally is 8.9%, far below the average level of 26.9% in developed markets. Considering that the average global gold mine production over the past five years is about 3,600 tons, if emerging markets increase the proportion of gold in their reserve assets to the same level as developed markets, the demand for gold will increase by 15,000 tons, meaning that adjustments in foreign exchange reserves in developing countries will consume about 4-5 years of gold production. If this process is gradually realized over the next decade, the incremental demand per year will be about 40%.
Extreme Scenario Two: Collapse of Crypto Assets
Bitcoin may face a "house of cards" crisis brought about by the quantum computing revolution and policy changes. On one hand, the countdown to the quantum revolution is loosening the technological foundation of Bitcoin. Google's Willow quantum chip, set to be released in 2024, achieves 105 quantum bits of computation, increasing the possibility of quantum computing breaking Bitcoin. On the other hand, Bitcoin may also be affected by policy changes, such as the liquidity shock from Trump issuing a personal digital currency. In summary, if there are breakthroughs in quantum computing or significant changes in policy, it may have a substantial impact on the value foundation of Bitcoin.
Bitcoin's market capitalization is $1.7 trillion, while gold's market capitalization is $19.6 trillion, making gold's market value approximately 10 times that of Bitcoin. Historically, when Bitcoin's price plummeted at the end of 2017, a small amount of safe-haven funds flowed into gold assets, leading to gold prices breaking through $1,270 per ounce. We assume that if the Bitcoin market drops by 20% in just 5 days due to systemic risk, and all Bitcoin funds flow into the gold market, it would be equivalent to an average daily purchase of $380 billion in gold, while the average daily trading volume of gold is about $250 billion, which would exhaust all liquidity in the gold market.
Extreme Scenario Three: Change of Reserve Currency
The dominance of the U.S. dollar as the global reserve currency may face structural collapse. As of the 2024 fiscal year, the scale of U.S. public debt held reaches $28.2 trillion; net interest expenditure on U.S. debt has reached $881 billion, exceeding defense spending. This unsustainable debt path has raised concerns among central banks about the credit of the dollar, and the dollar's status as a reserve currency may begin to weaken. Although the dollar index remains strong in the short term, the proportion of the dollar in central bank and government foreign exchange reserve allocations is gradually declining, accompanied by an increase in the proportion of "non-traditional reserve currencies" such as the renminbi.
Considering the evolution of the pound's global reserve currency weight, from 1899 to 1930, the pound's share in international reserves fell from 64% to 30%. We assume that the dollar's reserve weight declines from the current 55% to 30% over ten years. Given that the dollar's reserve weight has decreased by 0.8 percentage points each year over the past two years, and that global central banks have purchased a total of about 1,000 tons of gold, it can be linearly inferred that over ten years, global central bank demand for gold may increase by 30,000 tons, which would consume 8-9 years of gold mine production, resulting in an annual incremental demand of about 85%.
Extreme Scenario Four: Escalation of Geopolitical Conflicts
Assuming that geopolitical conflicts escalate into global military confrontations, gold, as the ultimate safe-haven asset, will undergo a revaluation. If military changes escalate, panic buying will drive gold prices up: on one hand, the collapse of currency credit in warring nations will trigger a public rush to hoard gold, and on the other hand, the vicious inflation caused by the military-industrial chain will force residents to seek physical value preservation. The Russia-Ukraine conflict has shown signs of gold soaring after the escalation of geopolitical conflicts: in March 2022, gold purchases by the Russian public surged by 234% year-on-year, and as geopolitical conflicts escalate, the supply-demand gap for gold will further widen, making gold a natural winner in hot wars.
When geopolitical conflicts escalate into global military confrontations, we assume that global debt will grow at a rate of 10% per year, and the new debt will be monetized, meaning that over ten years, an additional $91.5 trillion will be printed. Considering that in the context of escalating conflicts, credit currency will be somewhat ineffective, we assume that the newly monetized debt will ultimately be repaid in gold, meaning that the additional $91.5 trillion debt may be supported by the current 21,000 tons of gold, equivalent to each ounce of gold supporting $14,000 in debt **
Extreme Scenario Five: The Restoration of the Gold Standard
The reconstruction of the currency anchoring mechanism is the core driving force behind the rise of gold. The gold standard requires that the money supply be linked to gold reserves, which will directly limit the ability of central banks to excessively issue currency. Although global trade is still primarily based on fiat currency, some countries have begun to explore or practice gold settlement in specific scenarios, mainly focusing on economies facing financial sanctions or promoting de-dollarization. For example, due to being excluded from the SWIFT system, Russia partially uses gold settlement in energy trade; Iran completes international trade through gold and barter due to long-term U.S. financial blockades.
The debt scale and broad money of major developed economies and emerging economies are 57 trillion and 102 trillion USD, respectively. If major countries globally were to monetize their debt, it could lead the world back to the era of the gold standard, meaning that the current total of 159 trillion USD in currency could be supported by the current 21,000 tons of gold, equivalent to 24,000 USD per ounce of gold.
Report Body
Introduction: Reconstructing the Gold Pricing Paradigm
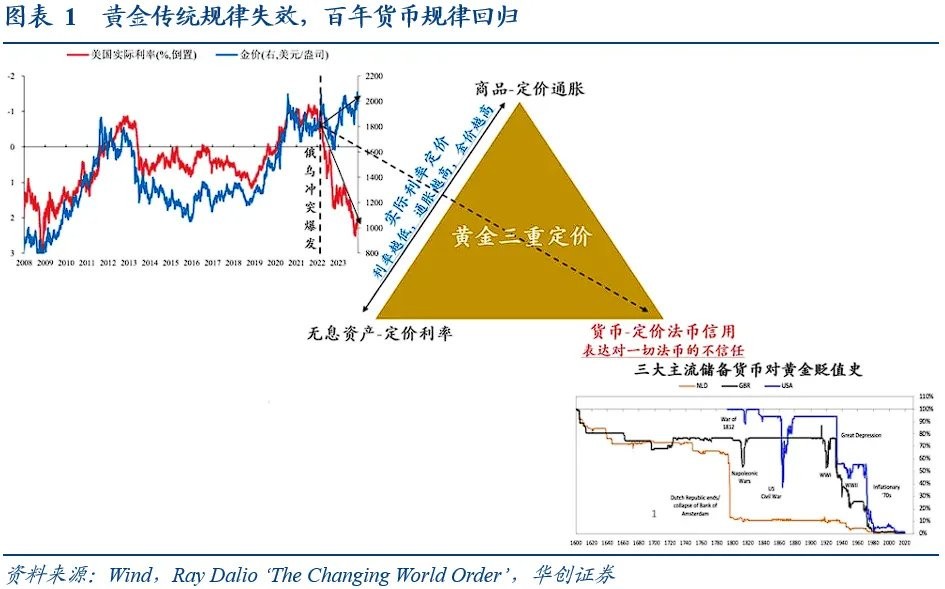
(1) Traditional Pricing Models Fail, Transitioning the Paradigm of Gold Pricing
Currently, the trend of gold prices is overturning traditional cognitive frameworks—under the pressure of a strong U.S. dollar index, gold prices have repeatedly reached new highs. As of February 10, 2025, the London spot gold price has surpassed the 2,900 USD mark. Mainstream global gold valuation models cannot effectively explain the rise in gold prices; whether through annual supply-demand valuation methods or quarterly macroeconomic equations, the explanatory power for gold prices has diminished. This reveals a core contradiction: the pricing logic of gold is shifting towards profound geopolitical games and fractures in the monetary system.
(2) Extreme Scenario Simulation Framework: The Non-linear Boundaries of Gold Price Elasticity
To measure the gold pricing logic under a century of change, we set aside the original macroeconomic equations and real interest rate models, returning instead to the ancient quantity theory of money to find potential growth space for gold prices through its monetary pricing. Therefore, based on the quantity theory of money and liquidity shock models, we considered the possibility of debt deficit monetization and explored the boundaries of gold prices under extreme scenarios.
**We simulate the transition path of gold from supply-demand imbalance to monetary system reset through a stepwise extreme scenario analysis: 1) Extreme Imagination One is that emerging markets increase the proportion of gold reserves, simulating a tenth-year gold price of 27,000 USD/ounce; 2) Extreme Imagination Two is that the Bitcoin market collapses, simulating a median gold price of 3,479 USD/ounce; 3) Extreme Imagination Three is that the reserve currency changes hands, simulating a tenth-year gold price of 93,000 USD/ounce; 4) Extreme Imagination Four is global international military conflict, simulating a tenth-year median gold price of 28,000 USD/ounce; 5) Extreme Imagination Five is a global return to the gold standard, simulating a tenth-year median gold price of 49,000 USD/ounce **
Extreme Imagination 1: Emerging Markets Increasing Reserves
(1) Logical Background: The Awakening of Gold Amidst the Cracks in the Dollar
The current dollar-dominated global monetary system is showing signs of cracks: first, the dollar system inherently faces the "Triffin Dilemma," as the U.S. debt/GDP exceeds 120%, and interest payments on U.S. debt surpass defense spending, leading to concerns among emerging markets about the sustainability of U.S. debt; second, catalyzed by the Russia-Ukraine conflict, the freezing of $300 billion in foreign exchange reserves of Russia by Europe and the U.S. has triggered an awakening in emerging markets. Meanwhile, the proportion of monetary gold in the reserve assets of major emerging markets is 8.87%, far below the average level of 26.89% in developed markets, indicating an urgent need for emerging markets to replace U.S. debt assets with gold.
Currently, there are signs of a systematic restructuring of foreign exchange reserve patterns in global emerging markets: China's gold purchases in 2024 are expected to reach 44 tons, accounting for 13.2% of the new demand from global central banks; the proportion of gold reserves held by the Reserve Bank of India is also rapidly increasing, rising from 8.09% to 11.35% in just two years; in 2024, the central bank with the highest gold purchases globally is the National Bank of Poland, with 90 tons. If emerging markets increase their gold reserve proportion from 8.87% to the average level of developed markets at 26.89%, they would need to purchase an additional 15,000 tons of gold, while the global gold production in 2024 is only 3,661 tons, equivalent to 4-5 years of gold production.
(2) Extreme Projection: Two-Phase Surge in Gold Prices
Phase 1: Central Bank Gold Purchases Create a Positive Feedback Loop. Emerging market countries begin to replace the dollar with gold, selling U.S. debt to forcibly convert to gold purchases, causing gold prices to skyrocket, triggering a chain reaction that forms a cycle of "the more you buy, the more expensive it gets, and the more expensive it gets, the more you buy." Therefore, the gold procurement by central banks will create a self-reinforcing positive feedback.
Phase 2: Global Gold Supply Chain Disruption. As gold prices rise and the uncertainty of gold prices increases, gold-producing countries may require government approval for gold exports through the "Critical Minerals Security Act," leading to significant delays in delivery times. At the same time, gold refineries may be classified as "strategic facilities," causing a sharp decline in global refining capacity. Therefore, we impose a supply shock on the annual global gold supply.
(3) Estimation Results: Measuring Gold Prices with Central Bank Gold Purchase Demand
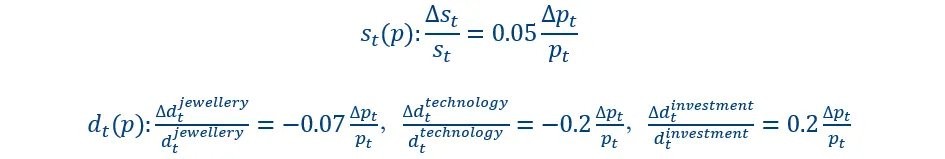
According to the World Gold Council (2020), we constructed a gold price prediction model based on supply and demand balance, utilizing the supply and demand data from the World Gold Council, and solving for the market equilibrium price using Newton's iteration method to simulate the gold price trend from 2025 to 2035. The supply and demand functions for gold are:

It is worth noting that the price elasticity coefficient of gold supply and demand is obtained from the regression of supply, demand, and price data from 2010 to 2024. In addition, we utilize IMF data to statistics reserve assets and monetary gold in emerging markets and developed markets, while also using the World Gold Council's supply and demand data for gold in 2024.
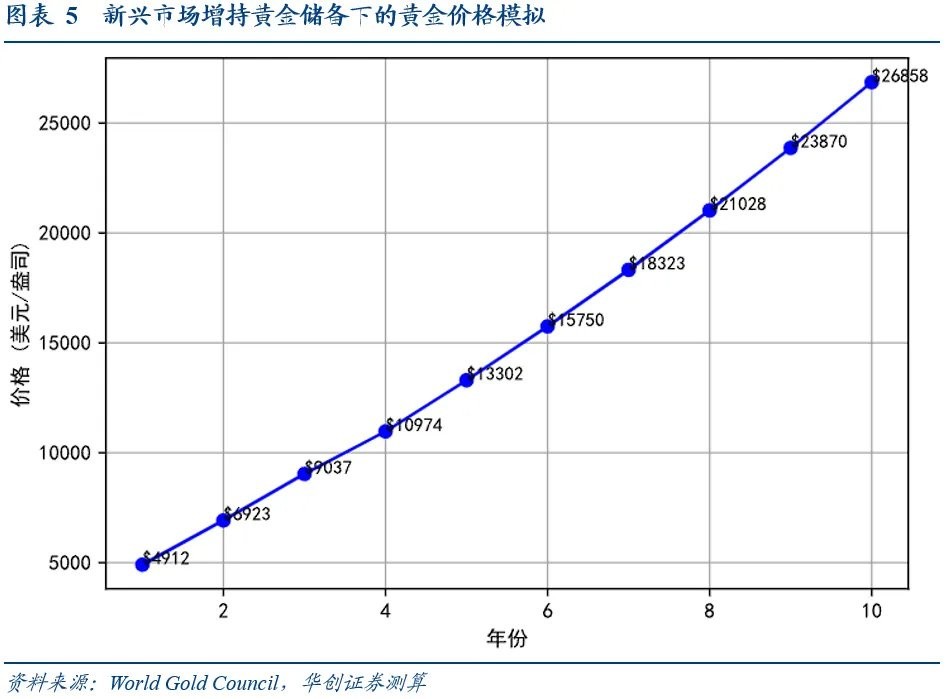
The model's calculation approach is that as emerging markets aim to raise their gold reserve share to the same level as developed markets over the next 10 years, it implies an annual central bank gold purchase demand of 1,500 tons, which will create an annual gold shortfall of about 500 tons. Through the supply-demand balance equation, this will ultimately lead to a continuous rise in gold prices, with gold prices potentially reaching $26,858 per ounce in 10 years.
Extreme Imagination Two: Collapse of Crypto Assets
(1) Logical Background: The "House of Cards" Crisis of Bitcoin
Bitcoin may face a "house of cards" crisis brought about by the quantum computing revolution and policy changes. On one hand, the countdown to the quantum revolution is loosening the technological foundation of Bitcoin. Google's Willow quantum chip, set to be released in 2024, achieves 105 quantum bits of computation, increasing the possibility of quantum computing breaking Bitcoin. On the other hand, Bitcoin may also be affected by policy changes, such as the liquidity shock from Trump issuing personal digital currency. In summary, if breakthroughs in quantum computing occur or significant policy changes take place, it could have a substantial impact on the value foundation of Bitcoin.
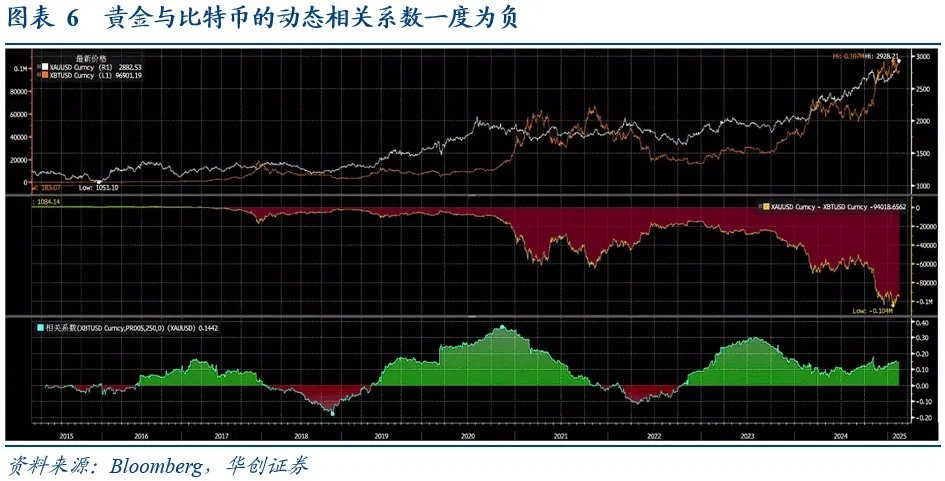
Bitcoin and gold prices once showed a negative correlation. As of March 9, 2025, Bitcoin's market capitalization was $1.67 trillion, while gold's market capitalization was $19.6 trillion, making gold's market cap about 10 times that of Bitcoin. From the rolling correlation coefficient, gold and Bitcoin prices once exhibited a negative correlation. After Bitcoin's price plummeted in December 2017, gold prices rose and broke through $1,270 per ounce, indicating a shift of funds towards gold after Bitcoin was impacted.
(2) Extreme Deduction: Capital Flight from Bitcoin
Gold Phase One: Capital flight from Bitcoin. The dynamic migration of Bitcoin funds triggers a pulse influx into gold. We assume that the migration of Bitcoin funds will last for 5 days, implying an average daily outflow of $66.8 billion. At this time, the negative feedback mechanism of the gold market is activated, and the short-term liquidity shock from Bitcoin funds significantly reduces the market depth of gold, leading to a decrease in the actual volume of funds being absorbed. **
Phase Two: Exhaustion of Gold Liquidity. Gold faces a liquidity shock, which conforms to a log-normal distribution, meaning that when a black swan event occurs, the effective depth of gold will significantly contract. The liquidity shock will trigger a price-depth negative feedback mechanism, where capital inflows lead to a decrease in liquidity depth. Therefore, the flow of funds from Bitcoin to the gold market will result in a nonlinear increase in gold prices.
(3) Estimation Results: Measuring Gold Prices with Bitcoin Market Capitalization
To predict the potential increase in gold as a global safe-haven currency in the event of a Bitcoin market collapse, we use Amihud's (2002) price impact model to calculate the gold price under a Bitcoin collapse. Amihud (2002) discusses the relationship between price impact, trading volume, and market depth. Thus, our constructed liquidity shock model is:

Where Q_BTC is the amount of Bitcoin capital migration, V_Gold is the average daily trading volume of gold, T is the liquidity shock time, γ is the liquidity elasticity coefficient, and λ is the market friction coefficient. For the liquidity elasticity coefficient and the market friction coefficient, we calibrate the parameters using the net capital flow of the gold ETF market, the average daily trading volume of the gold market, and gold price data from February 7, 2022, to March 8, 2022.
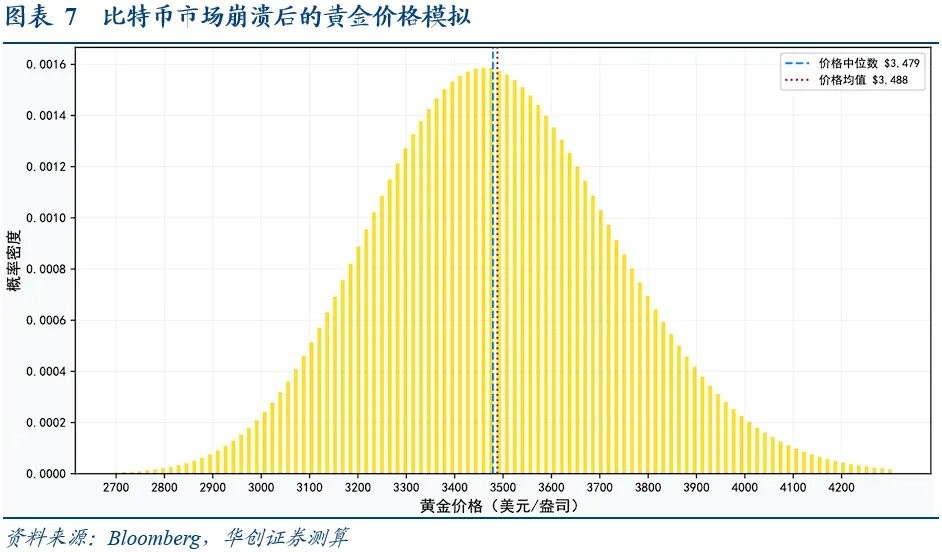
We use Bitcoin market capitalization data from the end of February 2025, the average daily trading volume of the gold market from 2024, and the total market capitalization of gold at the end of February 2024. The calculations reveal that the median gold price is $3,479 per ounce, while the 90% confidence interval for the gold price is $3,088 - $3,919 per ounce.
Extreme Imagination Three: Change of Reserve Currency
(1) Logical Background: Structural Collapse of Dollar Hegemony
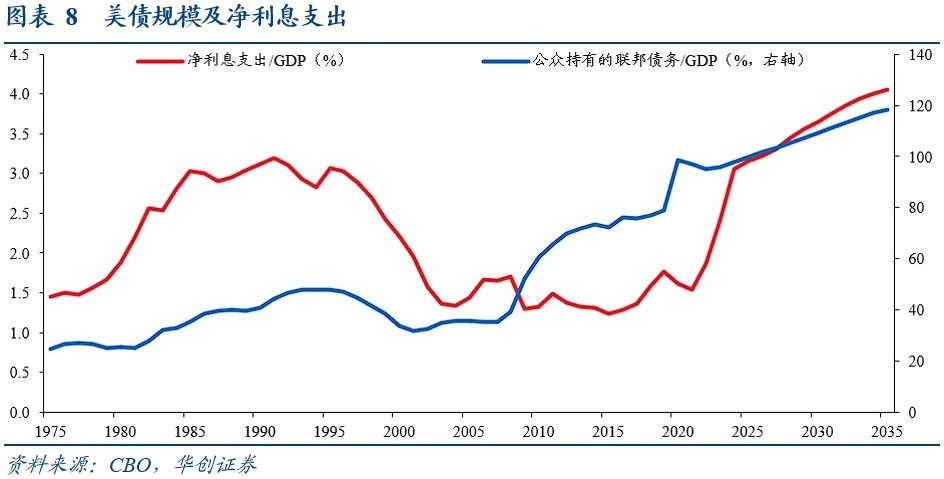
The dominant position of the dollar as the global reserve currency may face structural collapse. As of the 2024 fiscal year, the scale of U.S. public debt held reaches $28.2 trillion, accounting for 97.2% of GDP. According to CBO forecasts, this ratio will reach 107.2% by 2029, exceeding the historical peak of 106.1% in 1946. Meanwhile, in the 2024 fiscal year, net interest expenditure on U.S. debt reaches $881 billion, accounting for 3.1% of GDP, already surpassing defense spending at 3.0%. Therefore, this unsustainable debt path raises concerns among central banks about the credit of the dollar, and the dollar's status as a reserve currency may face loosening.
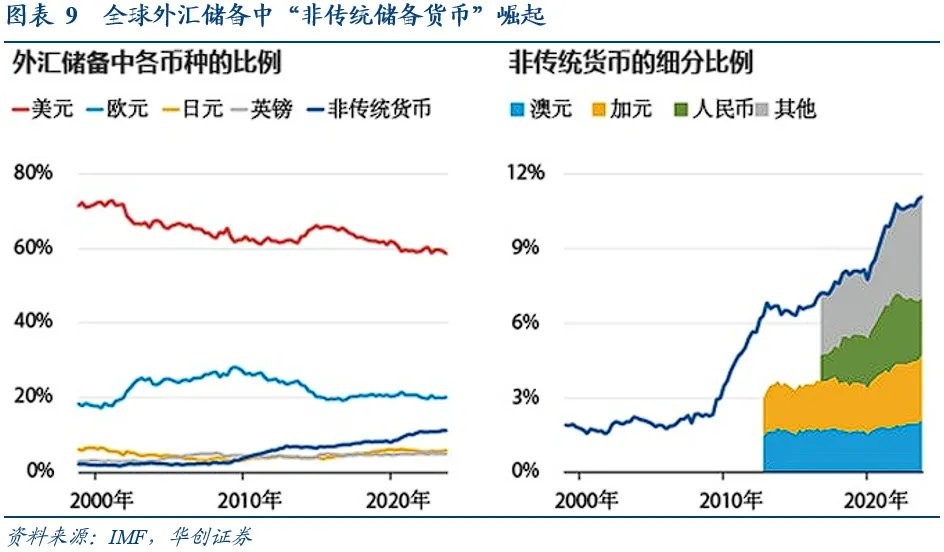
Although the US dollar index remains strong in the short term, the proportion of the dollar in central banks' and governments' foreign exchange reserves is gradually declining. Notably, while the role of the dollar has weakened over the past two decades, the proportions of the other three "major" currencies—euro, yen, and pound—have not correspondingly increased. Instead, there has been a rise in the proportion of so-called "non-traditional reserve currencies," including the Australian dollar, Canadian dollar, renminbi, South Korean won, Singapore dollar, and Nordic currencies.
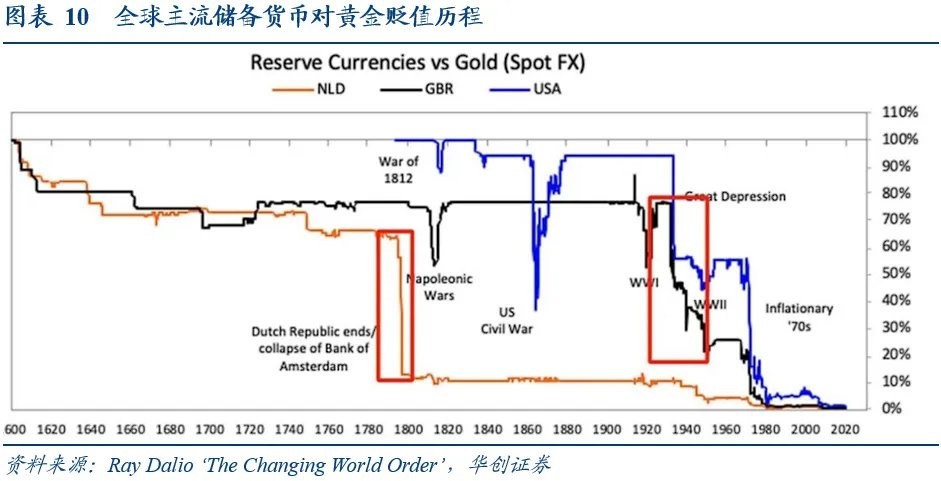
Looking back at the process of global reserve currency transitions, we have seen that gold has experienced a 3-10 times increase relative to the original global reserve currency. Ray Dalio (2021) pointed out that at the end of a long-term debt cycle, when the credit of the dominant currency collapses, gold often becomes the "hard currency" for wealth transfer. For example, after the collapse of the Bretton Woods system in 1971, when the dollar decoupled from gold, the price of gold soared from $35 per ounce to $850 per ounce in 1980, an increase of over 2300%.
(2) Extreme Projection: The Rise of Gold Amidst the Erosion of the Dollar's Status
Projection 1: Decline in the Weight of the Dollar. Considering the evolution of the pound's global reserve currency weight, from 1899 to 1930, the pound's share in international reserves fell from 64% to 30%. We assume that the dollar's reserve weight will decline from the current 55% to 30% over ten years. As the dollar's share continues to drop, more and more supranational currency initiatives will emerge, leading to a surge in actual gold demand and creating a positive feedback price spiral for gold.
Projection 2: Rise in the Status of Gold Reserves. Assuming that the dollar's reserve weight declines from the current 55% to 30% over ten years, considering that global central banks purchased approximately 1,000 tons of gold over the past two years with an annual decline of 0.8 percentage points in the dollar's reserve weight, it can be linearly inferred that over ten years, global central bank gold demand will increase by 30,000 tons, equivalent to consuming 8-9 years of gold mine production for the adjustment of global central bank gold reserves, resulting in an annual incremental demand of about 85%.
(3) Estimation Results: Measuring Gold Prices by Changes in the Dollar's Status
According to the World Gold Council (2020), we constructed a gold price prediction model based on supply and demand balance, utilizing the supply and demand data from the World Gold Council, and solving for the market equilibrium price using Newton's iteration method to simulate gold price trends from 2025 to 2035. Among them, the supply and demand functions for gold are:**
It is worth noting that the price elasticity coefficients of gold supply and demand are obtained from the regression of supply, demand, and price data from 2010 to 2024. In addition, we utilize IMF data to statistically analyze the reserve assets and monetary gold of emerging markets and developed markets, while also using the gold supply and demand data from the World Gold Council for 2024.
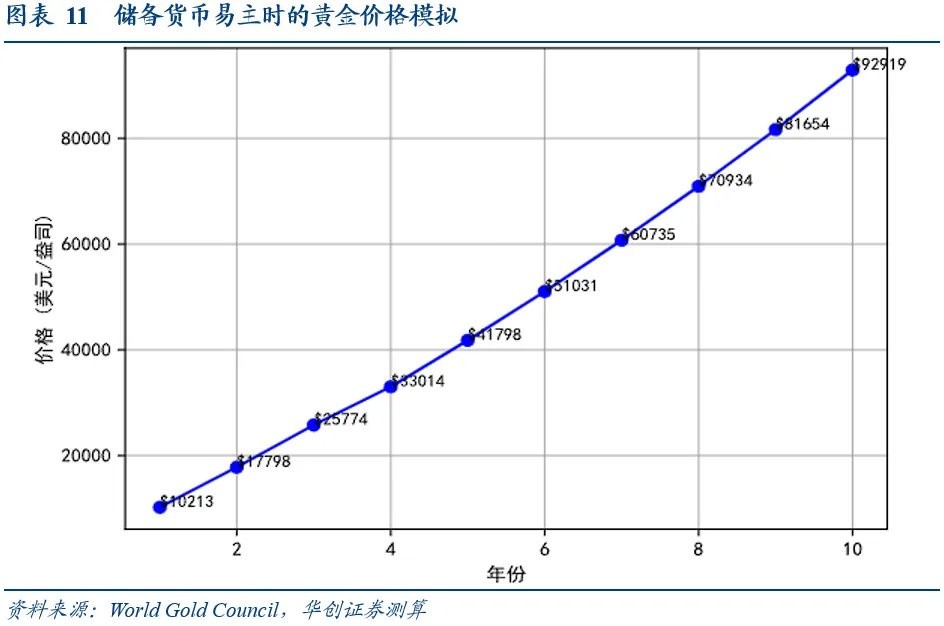
The model's calculation approach is based on the linear inference that over the next ten years, global central bank gold purchasing demand will increase by 30,000 tons, which means there will be an annual demand of 3,000 tons from central banks. This will create an annual gap of approximately 2,000 tons of gold, leading to a continuous rise in gold prices through the supply-demand balance equation. After ten years, the price of gold may reach $93,000 per ounce.
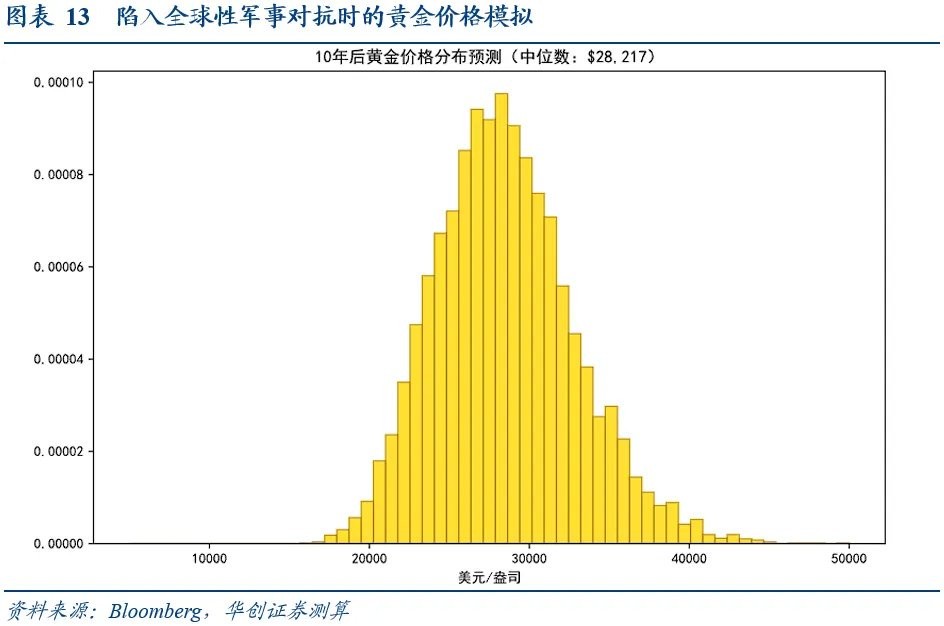
Extreme Imagination Four: Escalation of Geopolitical Conflicts
(1) Logical Background: Gold is the Natural Winner of Hot Wars
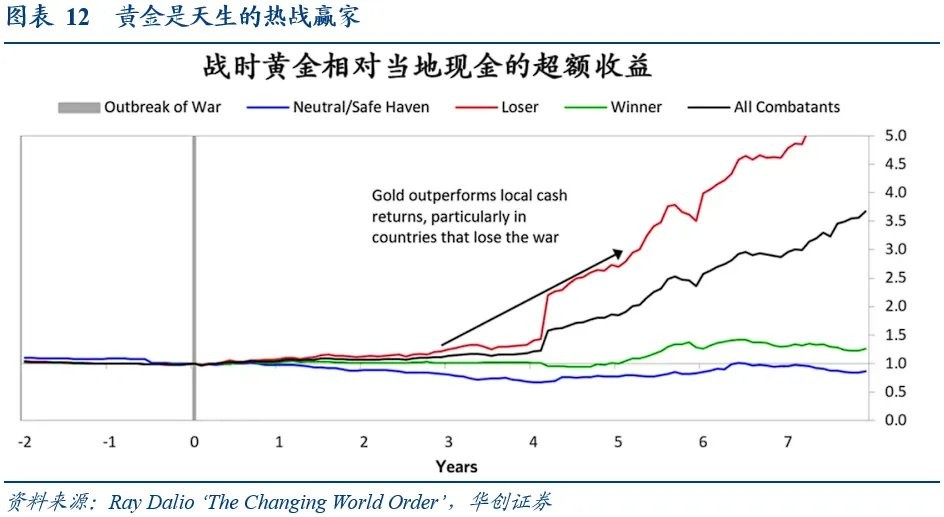
Assuming that geopolitical conflicts escalate into global military confrontations, gold, as the ultimate safe-haven asset, will undergo a value reassessment. Historical changes in global order have often been accompanied by military conflicts worldwide. When global military confrontations erupt, panic buying will drive up gold prices. On one hand, the collapse of currency credit in warring countries will trigger a surge in civilian gold hoarding; on the other hand, the vicious inflation caused by the military-industrial chain will force residents to seek physical value preservation. The Russia-Ukraine conflict has shown signs of gold soaring after the escalation of geopolitical conflicts, with gold purchases by the Russian public surging by 234% year-on-year in March 2022. When geopolitical conflicts escalate, the supply-demand gap for gold will further widen, making gold the natural winner of hot wars.
(2) Extreme Deduction: Spiraling Gold Supply-Demand Gap
Deduction One: Global debt experiences exponential growth. When geopolitical conflicts escalate into global military confrontations, we assume that the scale of global debt grows at a rate of 10% per year, and the new debt is realized through monetization. Considering that the current global debt scale is $57.4 trillion, this means that over ten years, the world will issue an additional $91.5 trillion in debt.
Deduction Two: Debt repayment in gold during military confrontation periods. Considering that credit currency may become ineffective to some extent in the context of escalating conflicts, we assume that the newly monetized debt will ultimately be repaid in gold, meaning that the additional $91.5 trillion in debt will be supported by the existing stock of gold. Inference Three: Government Seizure of Gold in Emergency Situations. Historically, during periods of global military confrontation, many countries have implemented forced gold seizure policies. For example, on April 5, 1933, U.S. President Franklin D. Roosevelt issued Executive Order 6102, requiring all American citizens to surrender gold items, such as coins valued over $100, to the Federal Reserve by May 1, 1933, in exchange for $20.67 per ounce of gold.
(3) Estimation Result: Measuring Gold Prices with Geopolitical Risk
Our extreme imagination is that the newly monetized debt will ultimately be repaid in gold, meaning that the new debt incurred during global military confrontations will be based on the value of globally available gold.

Where D_deficit represents the scale of the global fiscal deficit, and S_usable represents the global usable gold inventory; the Monte Carlo simulation assumes that gold prices exhibit random fluctuations, with a volatility of 15% based on 360 days of historical volatility.
We assume that the scale of global debt grows at a rate of 10% per year, and that the new debt is realized through monetization, meaning that over 10 years, an additional $91.5 trillion will be issued globally. The Monte Carlo simulation reveals that the median gold price is $28,000 per ounce. It is worth noting that our model assumes the global usable gold inventory S_usable is the total above-ground gold inventory of 216,000 tons by the end of 2024, which may actually overestimate the global usable gold inventory.
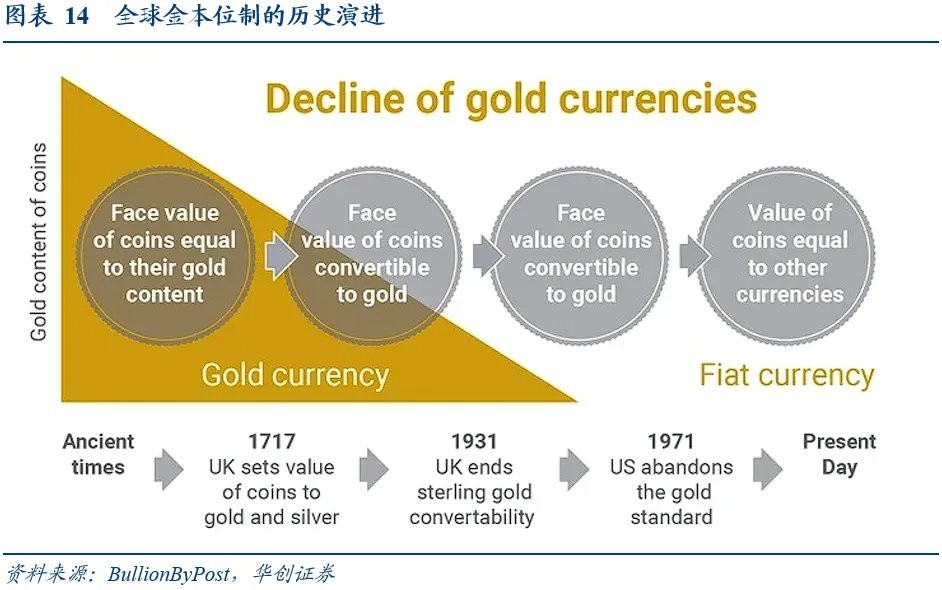
Extreme Imagination Five: Restoration of the Global Gold Standard
(1) Logical Background: Failure of the Modern Credit Currency System
If the world returns to the gold standard, gold prices will experience a comprehensive rise. The reconstruction of the currency anchoring mechanism is the core driving force behind the rise in gold. The gold standard requires that the money supply be linked to gold reserves, which will directly limit the ability of central banks to excessively issue currency. Taking the United States as an example, its current gold reserves are approximately 8,133 tons. If the gold coverage ratio is restored to 1:40, the supply of dollars would need to shrink significantly, and this monetary tightening effect would enhance the marginal pricing power of gold.
Non-Western countries' gold trade settlements have already begun to show signs. Although global trade is still primarily based on credit currencies, some countries have started to explore or practice gold settlements in specific scenarios, mainly concentrated in economies facing financial sanctions or promoting de-dollarization. For example, due to being excluded from the SWIFT system, Russia partially uses gold settlements in energy trade; Iran, long subjected to U.S. financial blockades, completes international trade through gold and barter trade.
(2) Extreme Deduction: The Ultimate Return to the Gold Standard
Deduction One: Global Debt Monetization. If sovereign countries monetize their debt, it will collaboratively drive excessive money supply globally. The price of gold will detach from the supply and demand fundamentals and enter a pricing black hole of sovereign credit collapse.
Deduction Two: Triggering Hyperinflation. With excessive money supply globally, the velocity of money circulation will break through conventional ranges. When the payment system collapses (such as wartime material rationing), the velocity of money circulation will surge.
Deduction Three: Return to the Gold Standard. Against the backdrop of global debt monetization and the triggering of hyperinflation, the modern credit currency system will be broken, and sovereign countries will return to the era of the gold standard, with the current gold stock being used to support global currency issuance.
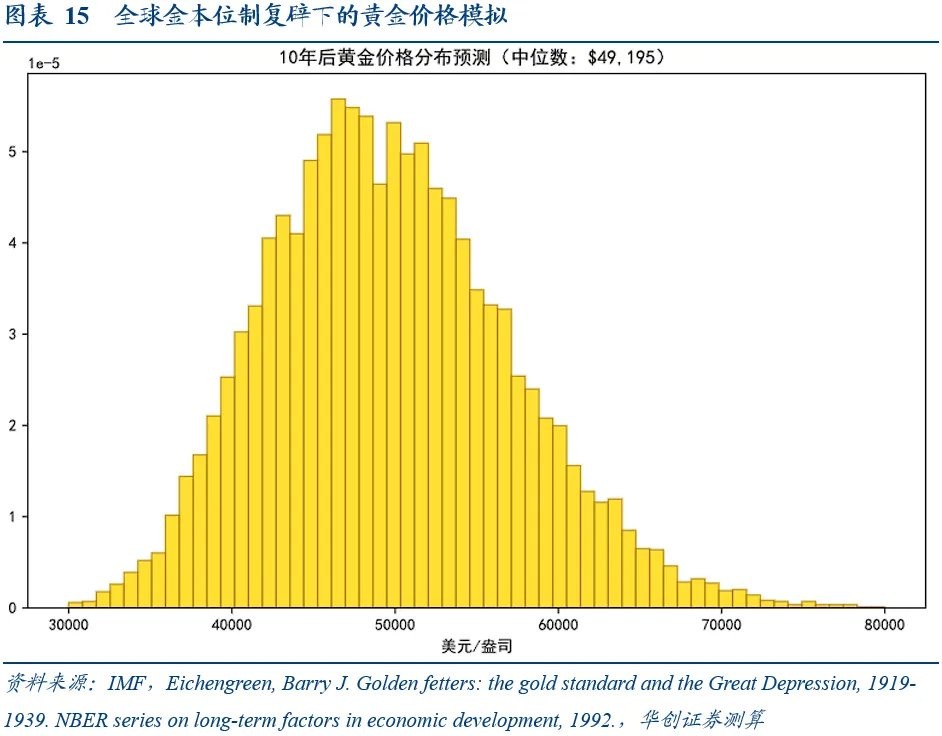
(3) Estimation Result: Measuring Gold Prices with Debt Deficits
Our extreme imagination five is the global implementation of fiscal deficit monetization, the disintegration of the credit currency system, and the return of the global monetary system to the gold standard era. According to BJ Eichengreen (1992), gold is the value anchor of currency, meaning that under the gold standard, the currencies of various countries are directly linked to gold, and currency can be freely exchanged for a fixed weight of gold. Therefore, under the restoration of the gold standard, global debt and broad money will be based on the available gold globally as the value foundation.

Where M_broad is the global broad money supply, D_deficit is the scale of global fiscal deficits, and S_usable is the global usable gold stock; the Monte Carlo simulation assumes that gold prices have random fluctuations, with a volatility of 15% based on 360-day historical volatility.
We use global broad data and fiscal deficit data from the 2023 IMF database: as of the end of 2023, the debt scale and broad money of major developed economies and emerging economies are 57 and 102 trillion USD, respectively. Through Monte Carlo simulation, we find that the median gold price is 49,000 USD/ounce. It is worth noting that our model assumes that the global usable gold stock S_usable is the total above-ground gold stock of 216,000 tons by the end of 2024, which may actually overestimate the global usable gold stock.
(3) Constraints of Limited Historical Samples Historical samples of extreme situations such as the change of reserve currency and the escalation of geopolitical conflicts are extremely limited, leading to serious sample bias in our projections of extreme scenarios. At the same time, even for similar situations, the time periods are difficult to compare with the present; for example, there is a systemic gap between the gold standard or the Bretton Woods system and the current fiat currency system. In addition, the collapse of cryptocurrencies and the restoration of the gold standard lack historical mapping, and extreme projections may have directional misjudgments.
Risk Warning and Disclaimer
The market has risks, and investment should be cautious. This article does not constitute personal investment advice and does not take into account the specific investment goals, financial situation, or needs of individual users. Users should consider whether any opinions, views, or conclusions in this article are consistent with their specific circumstances. Investing based on this is at one's own risk.
