


Gold Surges $188 in a Single Day: Macro Factors Were Just the Spark, Short Squeeze Was the Main Driver
The triple signals of a sharp drop in ADP Employment Data, the US dollar falling below 100, and oil prices plunging 5.5% ignited a surge in gold on the same day. However, the true driver was the concentrated short-covering by CTA trend funds at the key technical level of $4,200. Institutional investors have not yet entered long positions, creating a clear buyer vacuum after the CTA shorts were cleared. The Non-Farm Employment data and July CPI will determine whether this short squeeze is a fleeting event or a trend reversal
On August 5, gold staged a short squeeze driven by position structure.
Spot gold soared $188 in a single day, up 4.48%, to close at $4,246.79 per ounce—its largest single-day gain since February and the highest closing price since June 18.
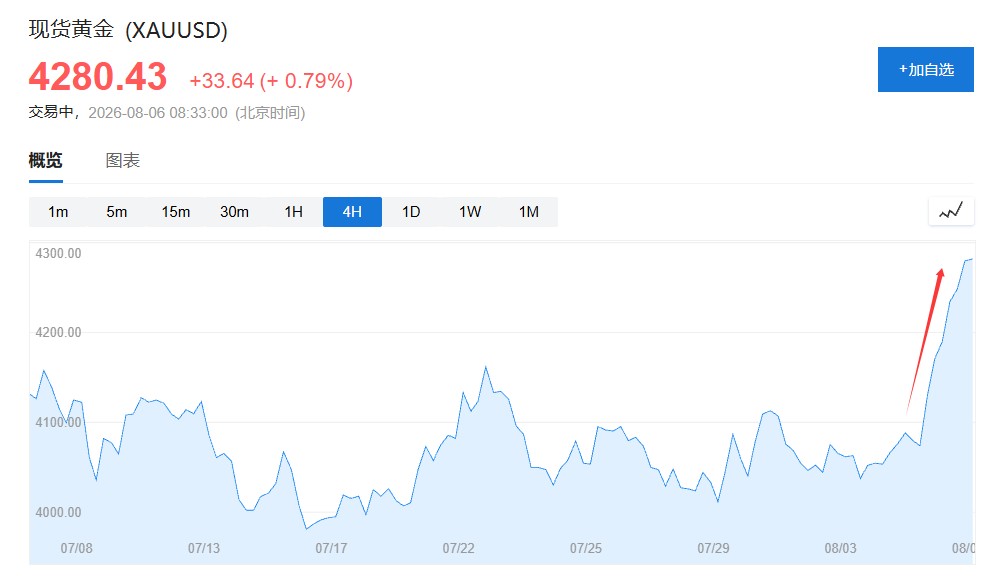
Three macro signals were released intensively on the same day: ADP added only 44,000 jobs in July, far below the market expectation of 70,000; Trump publicly stated that negotiations with Iran were progressing "very well" and that the Strait of Hormuz would reopen "soon," leading to a 5.5% single-day drop in WTI crude oil; the US Dollar Index fell below 100 to 99.70, its lowest level since late June.
These three lines converged in the interest rate market. The probability of a September rate hike plummeted from nearly 70% to 56%, while the yield on the 10-year US Treasury note fell to 4.61%, and the 2-year yield dropped to 4.20%. The dual decline in interest rates and the US dollar provided textbook macroeconomic conditions for gold's rise.
Although weak employment data and easing geopolitical tensions provided initial catalysts for the market, the extraordinary 4.48% surge was not entirely driven by macro fundamentals. The core driver was the large-scale short covering by systematic trend-following funds (CTAs) after key technical levels were breached.
From the historical high of $5,595 on January 29, gold prices had cumulatively fallen about 24% by the end of June. CTA trend funds continued to accumulate short positions during this clean downward channel. On August 5, macro data pushed gold prices above the key technical level of $4,200, triggering a chain reaction of programmatic short covering—this was not a rally driven by buying pressure, but a squeeze where shorts were forced out.
Convergence of Three Signals, Technical Levels Become the Trigger
The market movement on August 5 followed a clear timeline.
The JOLTS job openings reported the previous day were below expectations (7.359 million vs. an expected 7.40 million), and gold prices rose only 0.54% that day—macro signals failed to break the technical pattern.
The real trigger point came on Wednesday. The ADP data was not only worse than expected but also showed weakening employment for the third consecutive month. Meanwhile, the 5.5% plunge in oil prices lowered inflation expectations, and both factors simultaneously reduced the pricing of rate hikes in the interest rate market. The yield on the 2-year US Treasury note fell to 4.20%, its lowest level since July 20.
In this combination, textbook bullish conditions for gold were present on the same day: a weaker US dollar, declining interest rates, and easing geopolitical risks leading to lower inflation expectations. This was sufficient to support a modest rise of 0.5% to 1%. However, the final 4.48% increase indicates that the macro narrative acted as the fuse at a specific moment, rather than the gunpowder itself.
Concentrated Closing of CTA Shorts Ignites Short Squeeze
Gold, which had fallen 24% from its January peak, attracted CTAs to continuously build short positions during the five-month downtrend. The Market Ear cited Goldman Sachs data on August 5, noting that CTAs still held net short positions in gold at that time.
The logic of CTA models is highly mechanical: input price trends, volatility, and momentum signals, and go short in a downtrend. However, when gold prices broke through $4,200—a level that coincided with the convergence of the downward trend line (extending from the January high) and the 50-day moving average—the models received reversal signals, and programmatic short-covering orders were triggered en masse.
This mechanism explains a key contrast: why weak JOLTS data the previous day only pushed gold up by 0.54%, while weak ADP data the next day triggered a 4.48% surge.
Data drove gold prices through the technical barrier. Once programmatic short covering started, it formed a self-reinforcing feedback loop: the first batch of short covering pushed prices higher, triggering more models to cover shorts, further lifting prices, and squeezing out more shorts.
Absence of Managed Funds Creates a Void in Buyer Structure
If the market movement on August 5 had been the result of institutions actively going long, one would expect to observe a gradual process of position building. The reality shown by CFTC data is quite the opposite.
The latest COT report as of July 28 showed that managed funds' net long positions in COMEX gold decreased by 3,258 contracts to 120,328 contracts. According to MacroAgentDesk data, net longs were also shrinking in the previous week. In other words, throughout the entire rebound of gold prices from around $4,100 to $4,200, active institutions were reducing positions rather than adding to them.
This structure means there is a clear buyer vacuum after the clearing of CTA shorts. The surge on August 5 was driven by the mechanical covering of systematic funds, not by the judgment-based addition of positions by fund managers. Whether the subsequent rally can be sustained depends on whether active capital is willing to step in.
The CFTC report to be released on August 8 (a snapshot of holdings as of August 5) will be the first hard data to answer this question—whether managed funds turned to add long positions on the day of the surge or continued to retreat will determine the nature of this short squeeze.
Central Banks and ETFs Provide Support, But Cannot Explain Single-Day Surge
Beyond CTAs and managed funds, two structural forces are shaping the medium-term landscape of gold, but neither can explain the single-day movement on August 5.
Data from the World Gold Council shows that global central banks made net purchases of 289 tons of gold in the second quarter of 2026, a year-on-year increase of 62%, setting a record high for any second quarter. The People's Bank of China increased its holdings by 33 tons in the second quarter, marking 20 consecutive months of net buying; Poland purchased 51 tons in a single quarter; the Bank of Korea resumed physical gold purchases on August 3, interrupted since 2013; and 45% of surveyed central banks plan to continue increasing holdings in the next 12 months.
The core logic of central bank gold purchases is diversification of foreign exchange reserves and de-dollarization. These funds buy slowly and in a dispersed manner, forming a widely recognized structural bottom support below $4,000, but they cannot explain a single-day 4% surge.
ETF funds were also moderate. The HuaAn Gold ETF (518880) saw net inflows for 14 consecutive trading days before August 3, totaling approximately RMB 4.864 billion, with a maximum single-day inflow of RMB 2.209 billion; the world's largest gold ETF, SPDR Gold Trust, rose to 1,009.3 tons from late July, adding 3.4 tons on August 4.
It is worth noting that after experiencing the weakest quarter on record in the second quarter (outflows of about RMB 20 billion), the return flow of Chinese ETF funds in late July mostly exhibited characteristics of retail investors buying the dip; SPDR's 3.4-ton increase amounts to less than $150 million, which is negligible compared to the global ETF outflow scale of $11.7 billion in March alone. ETF data suggests that pessimistic sentiment is recovering from extreme levels, but has not yet formed substantial upward momentum.
Non-Farm Payrolls Are the First Test After the Short Squeeze
The market has digested the poor ADP figure of 44,000, the probability of a September rate hike has dropped to 56%, and US Treasury yields have fallen significantly. Friday's Non-Farm Employment data is the first hurdle to test current pricing, with three scenarios corresponding to distinctly different directions.
If Non-Farm Payrolls are weaker than 44,000, the market narrative will switch from "declining probability of rate hikes" to "the rate hike cycle may have ended." The probability of a September rate hike could quickly drop below 45%, pushing the US dollar and US Treasury yields lower. Remaining CTA shorts will continue to be squeezed out, and managed funds may be forced to chase the rally, potentially pushing gold prices toward $4,350 or higher.
If Non-Farm Payrolls meet expectations (60,000 to 80,000), the ADP and JOLTS data have already provided sufficient signals of weakening. Non-farm figures in this range will not change the narrative of "cooling labor market," nor will they bring new downside surprises. Gold prices are likely to oscillate in the $4,200 to $4,250 range, with bulls and bears returning to balance.
If Non-Farm Payrolls exceed 120,000, it will directly impact the entire interest rate narrative established on August 5. The probability of a rate hike will rebound to above 65%, US Treasury yields will rise, and gold prices may give back half of the day's gains within two days. It is worth noting that all current employment forward-looking signals point to weakening, so a reading above 120,000 would constitute the biggest surprise.
Current market pricing already leans towards the pessimistic scenario. The real risk lies not in how bad the Non-Farm data is, but in whether it will be unexpectedly good.
From Short Squeeze to Trend Reversal, Two Pieces of the Puzzle Remain
The market movement on August 5 leaves a core question: Is this a one-time technical release driven by events, or the starting point of a trend reversal?
The first piece of the puzzle is the directional shift of CFTC managed funds. If the COT report on August 8 shows that managed funds significantly added long positions on the day of the surge, with net longs rising significantly from the 120,000 contract level, it means active institutions have begun to recognize the existence of a bottom. The resonance of these two types of capital will lay the foundation for upgrading the short squeeze into a trend rally. Conversely, if managed funds continue to watch from the sidelines or even reduce long positions, the buyer vacuum after the short squeeze will be the biggest downside risk.
The second piece of the puzzle is the July CPI to be released next week. The drop in the probability of a rate hike from 67% to 56% currently relies on the single-line narrative of weakening employment data. If inflation data also shows a downward trend, the market will switch from "pausing rate hikes" to "countdown to rate cuts"—this is a fundamental shift in pricing nature. The former is merely a reduction in bearish factors, while the latter is the active initiation of bullish factors. If CPI remains strong, interest rate pressure will persist, limiting gold's upside space.
In addition, changes in open interest in COMEX futures will provide additional verification. Pure CTA short covering will be reflected in a decrease in open interest; if open interest increases while prices rise, it means true bulls are entering incrementally, and the sustainability of the rally will be significantly different.
If none of the above pieces fall into place—Non-Farm Payrolls exceed expectations, CPI remains strong, and managed funds continue to reduce longs—the $188 surge on August 5 will be just a spectacular short squeeze event. Gold prices will return to the oscillation range above $4,000, waiting for the next true catalyst.
