


BofA Bull & Bear Indicator Hits Highest Level Since 2021! Hartnett: Stick to the Summer Retreat Strategy
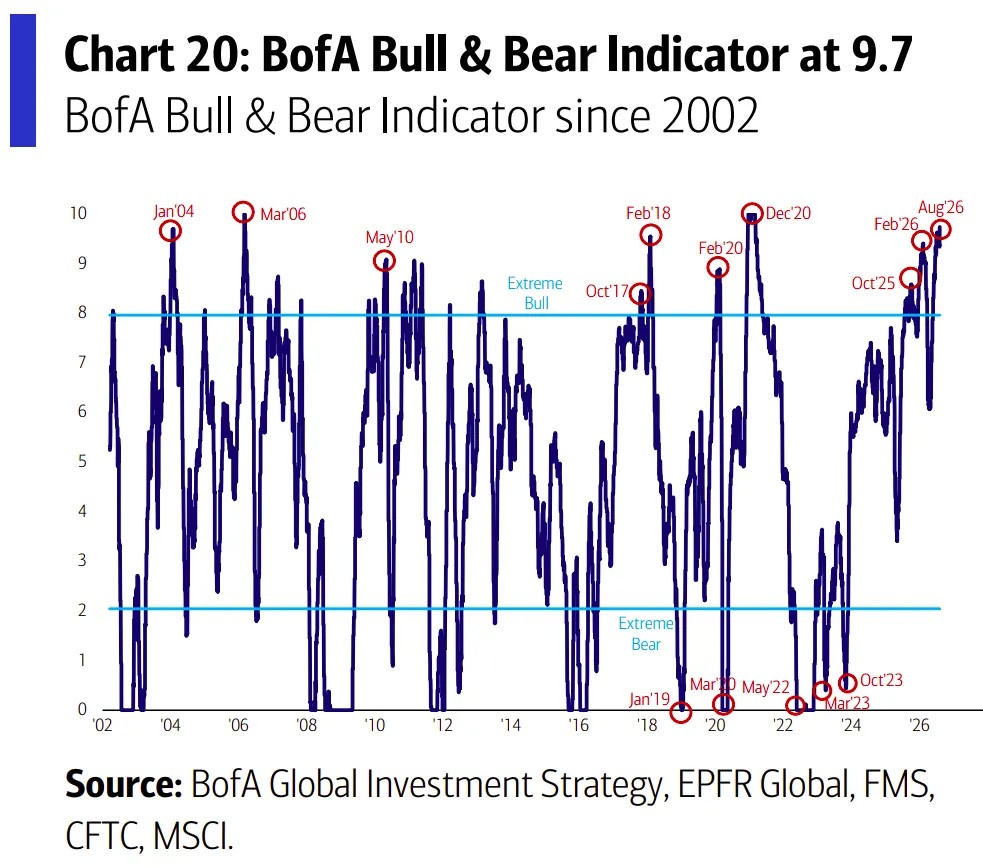
For the week ended August 5, capital flooded into US equities and credit markets, pushing the BofA Bull & Bear Indicator to 9.7 and triggering a sell signal. BofA strategist Hartnett maintains his "summer retreat" strategy, recommending a shift to defensive sectors. While AI and earnings support the bull market, positioning is extremely crowded, and semiconductor ETFs have seen outflows for the first time. Future key risk validation factors will include the Jackson Hole meeting, AI capital expenditure, and the Bull & Bear Indicator
Risk appetite in US stocks is rising to extreme levels. The latest report from Michael Hartnett, Chief Investment Strategist at Bank of America Securities, shows that the BofA Bull & Bear Indicator has risen to 9.7, its highest level since 2021, formally triggering a sell signal.
As funds continue to pour into US equities and credit markets, driving risk appetite higher, Hartnett has not chosen to chase the rally. Instead, he continues to adhere to his "Summer Retreat/Rotate" strategy, advising investors to reduce exposure to high-risk assets and shift toward defensive sectors and duration assets.
He believes that while the market remains in a bull cycle, the degree of crowding has reached a stage that warrants caution.
Capital Floods In, Market Crowding Reaches Extremes
According to BofA citing EPFR Global data, global cash inflows totaled $534 billion for the week ended August 5, with equity markets receiving $32.9 billion in inflows.
The credit market also performed strongly. Investment-grade bonds saw inflows for the 18th consecutive week, with net inflows of $10.2 billion for the week, bringing the annualized inflow scale to $527 billion, poised to break historical records; high-yield bonds saw single-week inflows of $4.1 billion, the largest scale since July 2024.
The pace of capital inflows into US equities has also reached historic highs. Year-to-date, the annualized inflow scale into US equities has reached $652 billion, approaching record levels.
However, in Hartnett's view, the influx of capital itself is becoming a risk signal.
The BofA Bull & Bear Indicator rose from 9.4 to 9.7, primarily driven by increased inflows into high-yield bonds, continued narrowing of credit spreads, and improved breadth in global equity index gains.
Looking at sub-indicators, investor positioning has entered extreme territory: the BofA Fund Manager Survey (FMS) shows equity positioning at the 99th percentile historically, equity fund flows at the 97th percentile, and hedge fund positioning at the 80th percentile.
The market is trading on a highly consensus optimistic expectation.
Semiconductor ETFs See First Outflow as Crowded Trades Loosen
Although overall capital continues to flow into risk assets, some popular trades are showing signs of cooling.
Data shows that semiconductor ETFs experienced their first outflow in six weeks last week, with net outflows of $2.4 billion. Previously, this sector had attracted approximately $50 billion in cumulative capital this year. The technology sector also saw $700 million in outflows, the first time in six weeks.
Hartnett believes this may indicate marginal changes in the previously most crowded AI trade.
However, the market has not yet seen significant risk release. Large tech companies remain supported by expectations of growing AI capital expenditure, and investors are still betting that the artificial intelligence industry cycle can continue to drive earnings growth.
"EPS is the Engine, Financial Conditions are the Transmission"
Regarding the current logic of the bull market, Hartnett offers a summary: "EPS is the bull market engine, but the Financial Conditions Index (FCI) is the transmission."
He believes that coordinated foreign exchange intervention last week alleviated previous deleveraging pressures in the market, referred to as the "Poor Man’s LTCM" event. This event refers to forced liquidations by some leveraged funds following increased market volatility, causing short-term liquidity pressure. Although its scale cannot be compared to the 1998 LTCM crisis, it reflects the impact of tightening financial conditions on the market.
In Hartnett's view, timely policy intervention has further reinforced market expectations—that when financial conditions tighten rapidly and threaten asset price stability, policymakers may still take measures to provide support. Therefore, the key to the current bull market depends not only on earnings growth but also on whether the financial environment can remain accommodative.
From a fundamental perspective, market optimism is still supported by earnings. BofA data shows that forward earnings expectations for the next 12 months have increased by 33% year-over-year. Approximately $35 billion in tariff refunds over the past three months has also buffered corporate cost pressures to some extent.
Meanwhile, productivity improvements brought by AI have not yet translated into large-scale layoffs, and the job market remains resilient. Hartnett believes this is also why the pricing logic in the bond market is changing: investors' focus is shifting from inflation to employment, with labor market data becoming a core variable influencing interest rate trends.
Strategically Bullish on Equities, Tactically Shifting to Defense
Although issuing risk warnings, Hartnett has not changed his long-term asset allocation view.
For the US market, BofA maintains its strategic judgment of "long equities, short bonds." The core logic is that policymakers now view the stock market as a systemically important asset.
Data shows that US household equity holdings increased by approximately $7 trillion this year. Coupled with cumulative wealth growth of about $18 trillion in 2024 and 2025, the wealth effect from the stock market is continuing to support consumption.
However, tactically, Hartnett has clearly chosen to "retreat." He advises investors to reduce exposure to risk assets and shift to defensive sectors such as consumer staples, while also focusing on duration assets like REITs, small-cap stocks, and biotechnology, as well as the US dollar.
Three Key Risk Windows Approaching
In the coming weeks, the market will face three key validation factors.
First is the Jackson Hole meeting on August 28. If July non-farm payroll data exceeds expectations, with new jobs exceeding 125,000 and the unemployment rate below 4.1%, the Federal Reserve may reissue hawkish signals, pushing yields higher and suppressing risk assets.
If employment deteriorates significantly, with new jobs below 50,000 and the unemployment rate rising above 4.3%, it could reinforce market expectations for rate cuts and economic slowdown, benefiting duration assets.
Second is whether AI capital expenditure can be sustained. BofA believes that current market valuations heavily rely on large tech companies continuing to invest in AI infrastructure. If the Roundhill Magnificent Seven ETF (MAGS) falls below $70, it may indicate that the logic of expanding AI capital expenditure is being challenged.
Third is the signal released by the Bull & Bear Indicator itself. Historically, when the BofA Bull & Bear Indicator approaches the full value of 10, it often means the market's risk-reward ratio is declining. The current reading of 9.7 serves more as a reminder for investors to control their positions rather than continue chasing the rally.
