


Earnings Beat, Record-Breaking Buybacks, Retail Investors Return—Citadel’s Top 10 Reasons to Be Bullish on US Stocks in August
"August could be the month when buyers return. In September, the question may be: how much buying ammunition remains?" Citadel's top 10 reasons for bullishness on US stocks in August include: Q2 earnings growth of approximately 33%, the strongest since the post-recession period; year-to-date net inflows into ETFs reaching $1.6 trillion, with July setting a monthly record; and over $1 trillion in buyback windows reopening this week. The firm believes that deleveraging has matured, buying power across multiple channels is strengthening simultaneously, and selling pressure is receding
On August 13, Scott Rubner, Chief Equity and Derivatives Strategist at Citadel Securities, released his latest market analysis report.
Against a backdrop of lingering macroeconomic risks and significant market divergence, Scott Rubner presented a bullish case based on ten key reasons. He argues that following a mature phase of deleveraging, multiple sources of demand are strengthening simultaneously, while selling pressure is subsiding.
There are many macro-level concerns, and most people asking me questions are asking the same thing: What could go wrong? This question remains important. But in August, I believe there is a more pertinent question: Who will be the buyers at higher prices?
Earnings Support Gains, While Valuations Compress
Reason 1: Earnings Beat Expectations
The S&P 500’s Q2 earnings per share (EPS) growth rate was approximately 33%, the strongest level seen outside of the post-recession recovery period.
More critically, Rubner points out that companies are not just beating already high expectations but are on the "steepest earnings revision path since 2000." As of August 9, 429 of the 503 constituent companies had reported results, covering 74% of the index's weight.
The message from US corporations is very simple: Earnings are beating expectations, and by a wide margin.
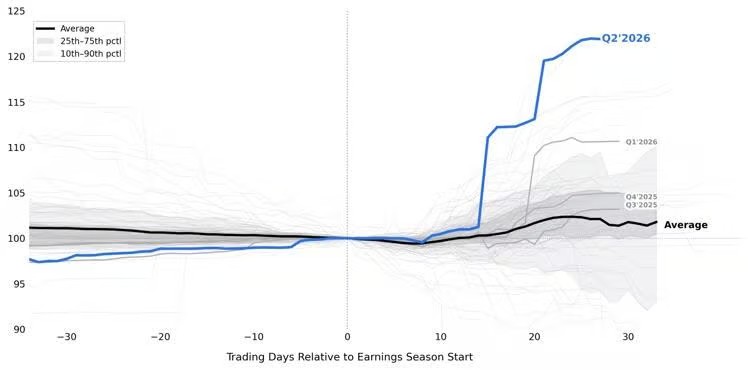
Chart: "S&P 500 EPS – Quarterly Revision Paths"
Reason 2: Valuations—Supported by Earnings, Not Multiple Expansion
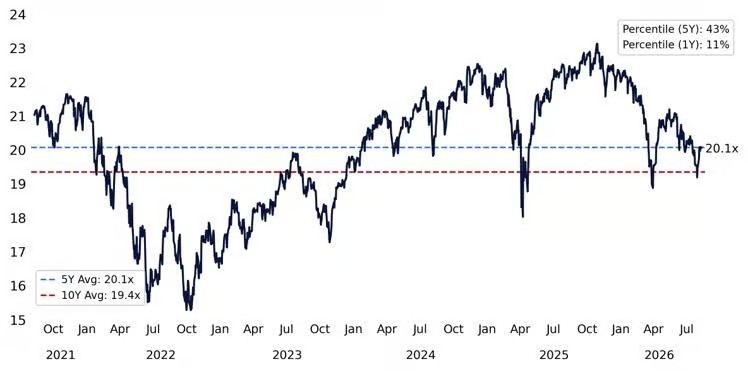
While the S&P 500 hit record highs, its 12-month forward price-to-earnings (P/E) ratio compressed from about 23.1x last October to approximately 20.1x currently, a compression of about 15%.
The reason is straightforward: The speed of upward earnings revisions has outpaced stock price gains.
The equal-weighted S&P 500 forward P/E is around 17.1x; the Nasdaq 100 forward P/E is below its 10-year average, sitting at the 11th percentile over the past year.
Rubner stated, "This is a completely different landscape from 1999. Currently, earnings are making the primary contribution, rather than valuation expansion."
Leverage and Capital Flows: Selling Pressure Has Passed, Buying Power Rebuilding
Reason 3: Leverage—Reset Maturing
Rubner believes that the global leverage reset "looks increasingly mature." The impact of systemic deleveraging is largely complete, and the overhang of rule-driven selling pressure has shrunk.
The logic is: As volatility continues to decline and trends rebuild, systematic strategies (such as CTAs and risk parity) will regain the ability to add positions.
The next meaningful mechanical capital flow may be re-leveraging, rather than deleveraging.
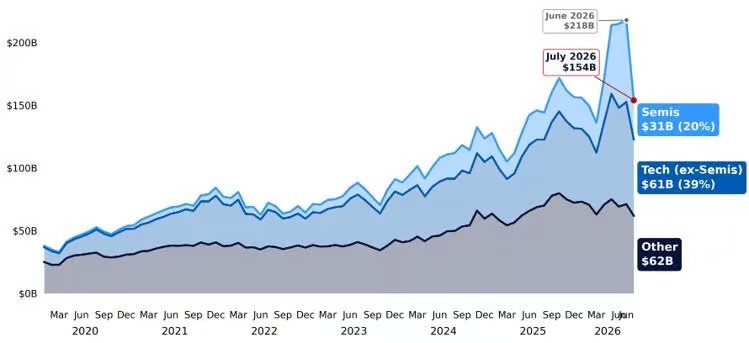
Chart: "Leveraged ETF Assets Under Management"
Reason 4: Retail Investors—Buyers Are Back
Last week, retail investors became net buyers again on the Citadel Securities platform, reversing the sell-off seen in late June.
However, the signal Rubner is watching more closely is in the options market: The put/call ratio among retail investors in the options market biased towards calls for the first time since April this year, and recorded the lowest put reading since the low in late March.
Meanwhile, activity in broad-based ETF options surged. The average daily contract volume this month reached 3.1 times the monthly average, setting a historical record; the average daily net put option premium was about $29 million, approximately 8 times the one-year average and nearly 10 times the historical average.
Rubner’s assessment is:
Retail investors are buying back into the market, but they are still paying for downside risk. Participation has returned, but confidence has not fully caught up.
He also highlighted a potential path: The market can quickly move from caution to participation, and then to chase rallies.
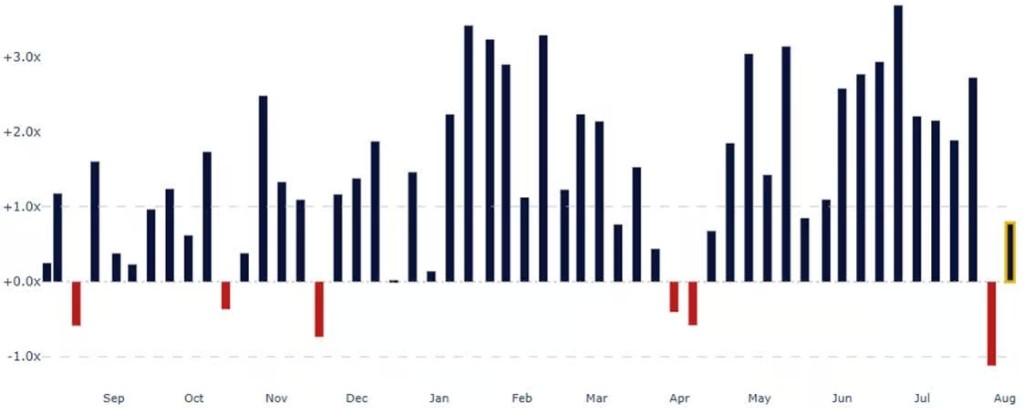
Chart: "Retail Cash Equities – Net Notional"
Reason 5: Passive Capital—Never Left
Household demand for passive ETFs remains extremely strong.
Year-to-date net inflows into ETFs totaled approximately $1.6 trillion, equivalent to about $7.5 billion per day, which is 55% higher than previous records.
Net inflows in July alone approached $350 billion, setting a new monthly historical record. Four months in 2026 have already ranked among the top ten for single-month net inflows on record.
Rubner’s conclusion is concise:
Structural passive buyers never left.
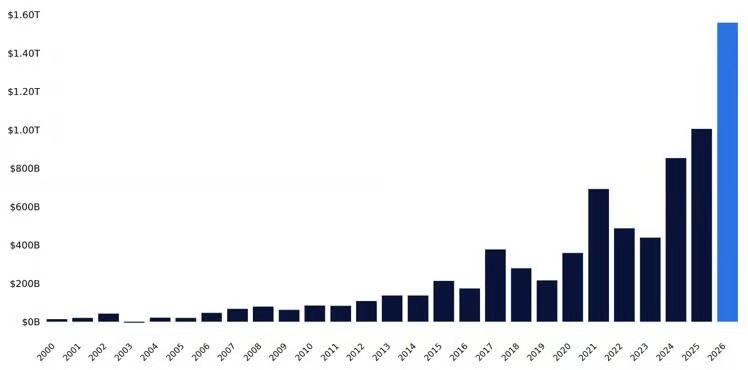
Chart: "ETF Net Inflows – Strongest Yearly Pace in History"
Buybacks and Structure: Over $1 Trillion in Corporate Buying Returns to Market
Reason 6: Buybacks—$1 Trillion Window Reopens
This week, the corporate buyback window reopened, with announced authorization sizes exceeding $1 trillion, the largest scale on record for this calendar period.
Historically, August is one of the stronger months for buyback execution, where buyback volumes should exceed stock issuance, continuously absorbing market supply.
Notably, this is not a story exclusive to the tech sector. Among the largest buyback authorizations year-to-date, nearly 70% came from sectors outside of technology.
"Corporate buying is returning, and it should increasingly benefit ordinary stocks."
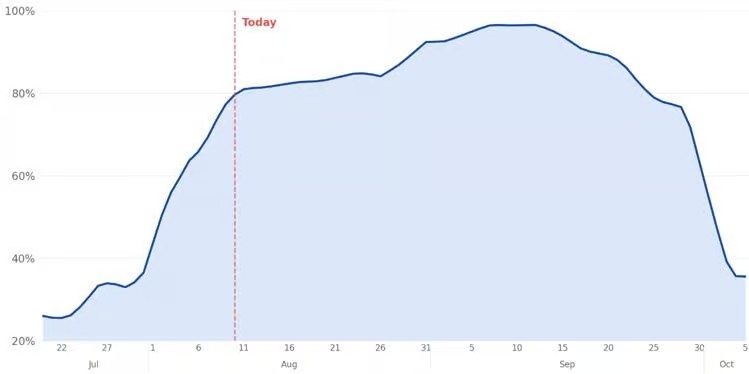
Chart: "Projected Buyback Window"
Reason 7: Index Structure—The S&P 500 Is Not the Average Stock
Rubner believes this is the most important point in understanding why the current market is "so difficult to grasp."
This year, when the Philadelphia Semiconductor Index (SOX) fell more than 3% in a single day, the S&P 500 dropped by an average of only 0.8%, compared to the historical average decline of 2.4% over the past 20 years. The software sector performed positively on average during these days, marking the first time this has happened since 2001.
The reasons lie in index composition, weight concentration, and the flow of marginal passive capital.
"You can simultaneously see a market with brutal internal dynamics and an index performing robustly. Both are true."
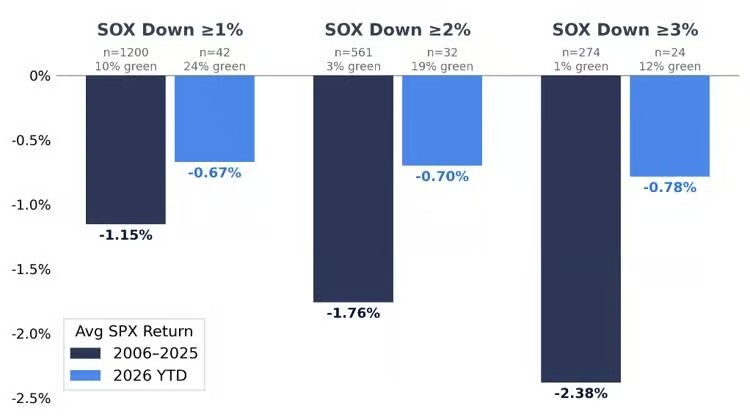
Chart: "Average SPX Move on SOX Selloff Days"
Market Structure Improvement: Breadth, Volatility, and Options
Reason 8: Rising Breadth, Correlation Hits Lows
More than 70% of S&P 500 constituents are trading above their 200-day moving averages, representing the strongest market breadth since December 2024.
At the same time, both 1-month and 3-month realized correlations are near historical lows.
Rubner’s interpretation: The combination of rising breadth, declining correlation, and high dispersion creates a richer environment for stock selection, expanding the opportunity set for individual stock Alpha.
The equal-weighted S&P 500 (SPW) has outperformed the market-cap-weighted S&P 500 (SPX) over the past year.
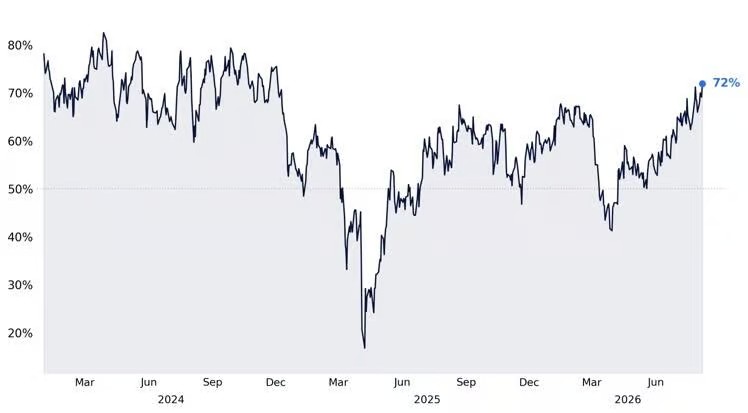
Chart: "S&P 500 – % of Members Above Their 200-Day Moving Averages"
Reason 9: Volatility—Below 15 Changes the Math
Volatility is shifting from being an outcome to an input variable.
Low volatility is typically viewed as a result of rising stock markets. However, when the 30-day and 60-day realized volatility windows shift lower, low volatility itself creates additional room for systematic strategies to add positions—this is a positive feedback mechanism.
Meanwhile, extreme implied volatility in the semiconductor and memory chip sectors is beginning to normalize. This month, the average 3-month at-the-money implied volatility for the top 10 SOX constituents in the S&P 500 dropped by nearly 20 percentage points; the spread between VIXEQ and VIX has also narrowed significantly from historical highs.
"Low volatility is no longer just describing the market; it is starting to change the math of capital flows."
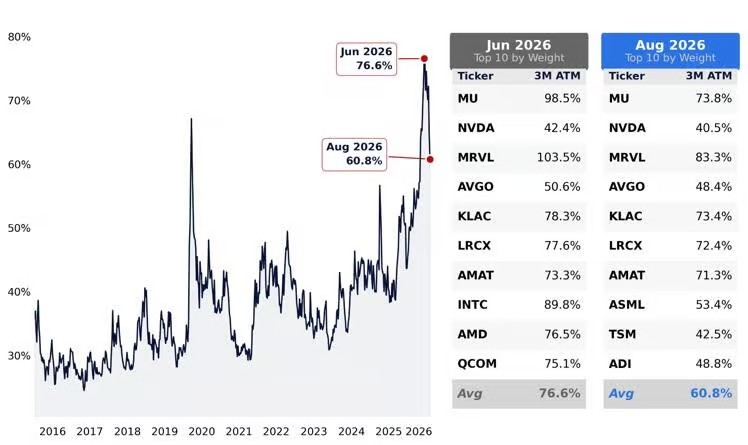
Chart: "Semiconductor Leadership Implied Volatility"
Reason 10: Options—Starting to Hedge Upside
This is the signal Rubner is monitoring most closely.
August 4 was the highest single-day volume for SPX call options in history, with volume approximately twice the one-year average and 10% higher than the previous record set in May. The five trading days from July 30 to August 5 also marked the largest cumulative five-day volume for SPX call options on record.
More critical data: Nearly 35% of S&P 500 constituents showed a 3-month call skew inversion (where call option implied volatility is higher than put), the highest proportion on record.
Rubner stated:
"Investors are not just reducing payments for downside protection. In parts of the market, they are willing to pay more for upside convexity. This behavioral shift is significant; it represents a completely different psychology."
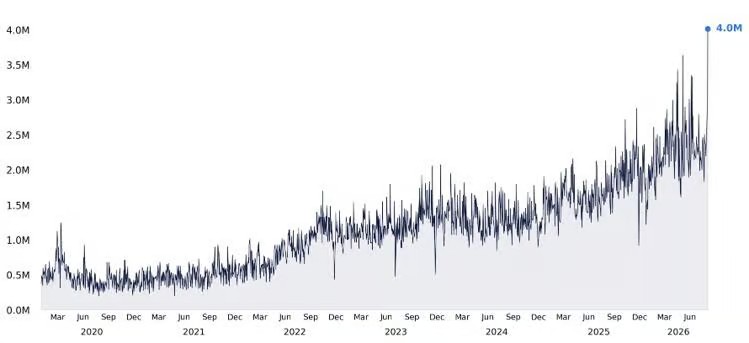
Chart: "SPX Call Volumes"
Bottom Line: The List of Buyers Is Lengthening
Rubner summarized at the end of the report:
This remains a difficult market. Macroeconomic risks are real, and the path will not be linear. But after going through this list, one thing stands out: The balance of capital flows is tilting in a more positive direction.
He also highlighted risks for September: Seasonal deterioration, potentially fuller positions, and if August evolves into a rally-chasing phase, today's buying capacity will have been consumed by then.
August could be the month when buyers return. In September, the question may be: how much buying ammunition remains.
