


Hua Hong Grace Q2 Revenue Hits ATH, Net Profit Surges 386% YoY, Q3 Revenue Guidance Up to $780 Million | Financial News
More updates to follow
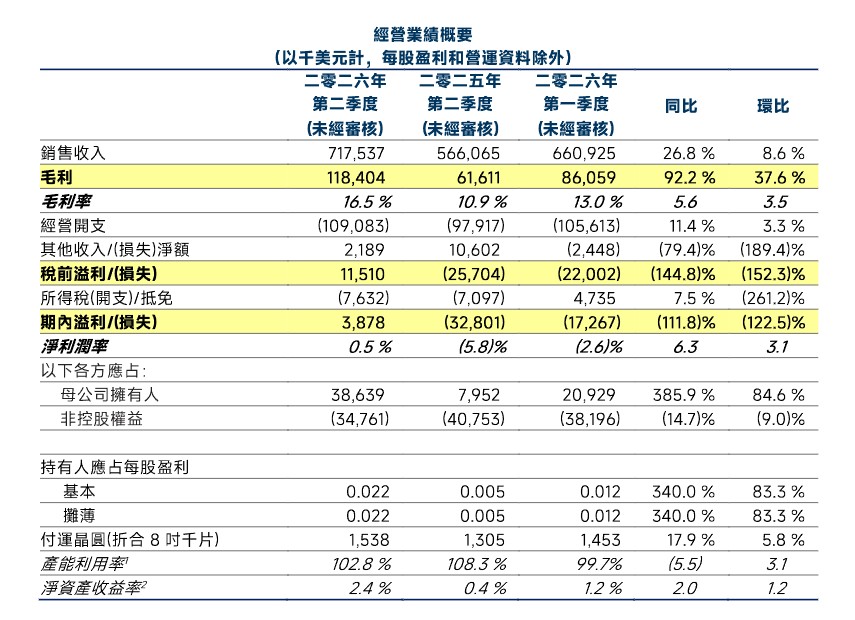
Hua Hong Grace disclosed its second-quarter 2026 financial results: The company's quarterly sales revenue reached $717.5 million, hitting an ATH (All-Time High), representing a year-over-year increase of 26.8% and a quarter-over-quarter increase of 8.6%; the gross margin was 16.5%, up 5.6 percentage points year-over-year and 3.5 percentage points quarter-over-quarter. Both revenue and gross margin exceeded the company's previous guidance, indicating a continued recovery in the prosperity of specialty process foundry services.
Improvements on the profitability front were even more significant. The company's gross profit in the second quarter was $118.4 million, up 92.2% year-over-year and 37.6% quarter-over-quarter; net profit (profit attributable to owners of the parent company) was $38.6 million, surging 385.9% year-over-year and 84.6% quarter-over-quarter; basic earnings per share were $0.022, a 340% increase year-over-year. However, from a consolidated perspective, the profit for the period was only $3.88 million, with a net profit margin of just 0.5%, indicating that the company remains under pressure from expansion-related depreciation and rising financial expenses.
In terms of operations, Hua Hong Grace maintained high capacity utilization in the second quarter, with overall capacity utilization reaching 102.8%, an increase of 3.1 percentage points quarter-over-quarter; wafer shipments amounted to 1.538 million 8-inch equivalent wafers, up 17.9% year-over-year and 5.8% quarter-over-quarter. The company stated that product "volume and price both rose" this quarter, with average selling price increases and cost reduction efforts jointly driving gross margin improvement, although rising depreciation costs partially offset these gains.
Looking ahead to the third quarter, the company provided higher revenue guidance, expecting sales revenue of approximately $770 million to $780 million, representing a continued growth of about 8% from the second quarter based on the midpoint; gross margin is expected to be between 16% and 18%, suggesting that profitability is likely to remain within the range repaired in the second quarter. Management also noted that AI-driven semiconductor demand has gradually expanded from memory chips to logic, analog, and other related fields. The company's specialty process platforms have begun to benefit, although demand across different end markets remains differentiated.
Revenue Hits ATH: Driven by Shipment Growth and ASP Increase
In the second quarter, Hua Hong Grace's sales revenue was $717.5 million, an increase of $151.5 million or 26.8% year-over-year; and an increase of $56.61 million or 8.6% quarter-over-quarter. The company explicitly pointed out that revenue growth was mainly driven by two factors: an increase in the number of wafers shipped and a rise in average selling prices.
From a revenue structure perspective, wafer sales remain the absolute mainstay. Revenue from direct sales of semiconductor wafers in this quarter was $692.2 million, accounting for 96.5% of total revenue; other revenue was $25.36 million, accounting for 3.5%.
On the shipment side, the company shipped 1.538 million 8-inch equivalent wafers in the second quarter, an increase of 17.9% year-over-year and 5.8% quarter-over-quarter. Given that revenue growth outpaced shipment growth, the rise in ASP contributed significantly to revenue growth, which is also an important reason for the continued quarter-over-quarter repair of gross margin.
12-Inch Revenue Grows Faster, Share Rises to Over 60%
By wafer size, Hua Hong Grace's 8-inch wafer revenue in the second quarter was $271.8 million, up 17.0% year-over-year, accounting for 37.9% of total revenue; 12-inch wafer revenue was $445.7 million, up 33.5% year-over-year, accounting for 62.1% of total revenue.
The growth rate of the 12-inch business was significantly higher than that of the 8-inch business, with its revenue share further increasing from 59.0% in the same period last year to 62.1%. This reflects that in the company's "8-inch + 12-inch" strategy, 12-inch specialty process capacity is being continuously released and has become the core incremental driver of overall revenue growth.
In terms of capacity, the company's monthly capacity reached 508,000 8-inch equivalent wafers at the end of the second quarter, higher than the 489,000 wafers at the end of the first quarter and the 447,000 wafers in the same period last year. The overall capacity utilization rate was 102.8%. Although lower than the 108.3% in the same period last year, it rebounded significantly from 99.7% in the first quarter, indicating improved absorption of new capacity.
Gross Margin Rises to 16.5%, but Depreciation and Financial Expenses Still Suppress Net Margin
The company's gross profit in the second quarter was $118.4 million, up 92.2% year-over-year and 37.6% quarter-over-quarter; the gross margin was 16.5%, up 5.6 percentage points year-over-year and 3.5 percentage points quarter-over-quarter. The company explained that the improvement in gross margin was mainly due to rising average selling prices and cost reduction and efficiency enhancement efforts, partially offset by rising depreciation costs.
Pressure on expenses remains. Operating expenses in the second quarter were $109.1 million, up 11.4% year-over-year and 3.3% quarter-over-quarter, mainly due to increased employee expenses. Among these, administrative expenses were $104.4 million, up 10.3% year-over-year; selling and distribution expenses were $2.96 million, up 12.6% year-over-year; impairment losses on trade receivables and notes receivable were $1.72 million, an increase of 186.5% year-over-year.
Net other income was $2.19 million, down 79.4% from $10.6 million in the same period last year. The main drags came from rising financial expenses and declining government subsidies: financial expenses in the second quarter were $29.42 million, up 61.2% year-over-year; government subsidies were $4.68 million, down 52.5% year-over-year. However, the share of profits from associates amounted to $9.49 million, a significant year-over-year increase, which hedged part of the pressure.
Therefore, although the gross profit side saw significant repair, the consolidated profit for the period was only $3.88 million, with a net profit margin of 0.5%; profit attributable to owners of the parent company reached $38.6 million, mainly because non-controlling interests still recorded a loss of $34.76 million.
Non-Volatile Memory Becomes the Strongest Growth Point, Standalone NVM Revenue Up 149% YoY
By technology platform, all major platforms of Hua Hong Grace achieved growth in the second quarter, with non-volatile memory performing most prominently.
Embedded non-volatile memory revenue was $200.1 million, up 41.8% year-over-year, accounting for 27.9% of total revenue, mainly driven by increased demand for MCU and smart card chips.
Standalone non-volatile memory revenue was $68.8 million, up 149.3% year-over-year, with its share increasing from 4.9% in the same period last year to 9.6%, mainly benefiting from increased demand for flash memory products. This segment was the business with the greatest growth elasticity this quarter.
Power device revenue was $182.3 million, up 9.4% year-over-year, mainly from increased demand for general-purpose MOSFETs; analog and power management revenue was $183.1 million, up 13.0% year-over-year, driven by increased demand for other power management products; logic and RF revenue was $83.2 million, up 21.3% year-over-year, mainly from growth in demand for logic products.
Structurally, the revenue shares of embedded non-volatile memory, power devices, and analog and power management platforms were 27.9%, 25.4%, and 25.5% respectively, still constituting the basic foundation of the company's specialty process business; standalone non-volatile memory contributed the most obvious incremental growth this quarter.
Fastest Growth in 65nm and Below Nodes, Specialty Process Continues to Migrate to Higher Value-Added Areas
By process technology node, revenue from 65nm and below nodes in the second quarter was $205.1 million, up 63.4% year-over-year, accounting for 28.6% of total revenue, a significant increase from 22.2% in the same period last year. The company stated that growth in this node was mainly benefited from increased demand for flash memory and other power management products.
Revenue from 90nm and 95nm nodes was $174.4 million, up 19.9% year-over-year, accounting for 24.3%, mainly driven by increased demand for MCU and smart card chips.
Revenue from 0.11-micron and 0.13-micron nodes was $78.2 million, up 22.1% year-over-year; revenue from 0.15-micron and 0.18-micron nodes was $38.2 million, up 31.4% year-over-year; revenue from 0.25-micron nodes was $2.1 million, up 79.2% year-over-year, mainly from increased demand for RF products.
Revenue from 0.35-micron and above nodes was $219.6 million, up 9.4% year-over-year, remaining the single largest node by share, accounting for 30.6% of total revenue, mainly driven by increased demand for general-purpose MOSFETs.
Overall, traditional mature nodes continue to contribute stable cash flow, but the revenue share of 65nm and below nodes is rapidly increasing, showing that Hua Hong Grace's product portfolio in the specialty process field is migrating towards higher value-added directions.
China Market Still Contributes Nearly 80% of Revenue, North America and Europe Grow Faster
By region, the China market remains the basic foundation of Hua Hong Grace's revenue. Revenue from mainland China and Hong Kong in the second quarter was $563.7 million, up 20.0% year-over-year, accounting for 78.6% of total revenue. Growth mainly came from increased demand for MCUs, flash memory, general-purpose MOSFETs, logic, and smart card chips.
North American market revenue was $93.8 million, up 77.0% year-over-year, accounting for 13.1% of total revenue, mainly driven by increased demand for other power management and MCU products.
Revenue from other Asian regions was $32.0 million, up 11.6% year-over-year, mainly from increased demand for super junction and MCU products; European revenue was $28.0 million, up 90.1% year-over-year, mainly benefiting from increased demand for MCU and smart card chips.
Although the China market share remains high, the revenue growth rates in North America and Europe are significantly higher than the overall average, indicating that overseas customer demand is also recovering. However, in terms of volume, overseas revenue is still significantly smaller than the China market, limiting its decisive impact on the company's overall growth.
Consumer Electronics Remains the Largest End Market, Communication Revenue Declines YoY
By end market, consumer electronics continues to be Hua Hong Grace's largest source of revenue. Consumer electronics revenue in the second quarter was $481.3 million, up 34.7% year-over-year, accounting for 67.1% of total revenue, mainly driven by increased demand for flash memory, MCUs, other power management, and general-purpose MOSFET products.
Industrial and automotive revenue was $162.1 million, up 25.5% year-over-year, accounting for 22.6%, mainly from increased demand for other power management, smart card chips, and MCU products.
Communication product revenue was $62.5 million, down 12.8% year-over-year, with its share dropping to 8.7%, mainly due to decreased demand for analog products. This was the only segment among the major end markets to see a year-over-year decline, confirming management's statement that "the intensity and sustainability of demand in different end-market segments are differentiated."
Computing product revenue was $11.7 million, up 48.1% year-over-year, but its share was only 1.6%, mainly driven by increased demand for MCU products, currently contributing little to the company's overall revenue.
Operating Cash Flow Improves Significantly, Capital Expenditure Drops Clearly from Q1
In terms of cash flow, the net cash flow from operating activities in the second quarter was $338.1 million, up 99.3% year-over-year and 159.2% quarter-over-quarter, mainly due to increased collections from customers. The significant improvement in operating cash flow is another highlight of this quarter's financial report besides revenue and gross margin.
Net cash outflow from investing activities was $331.2 million, including fixed asset investment expenditures of $356.6 million and external investments of $16.1 million; meanwhile, the company received government subsidies for equipment of $25.4 million, interest income of $8.6 million, and dividends from associates of $7.3 million.
In terms of capital expenditure, total capital expenditure in the second quarter was $356.6 million, a significant decrease from $924.9 million in the first quarter. Among this, 12-inch related capital expenditure was $325.9 million, and 8-inch related capital expenditure was $30.7 million. 12-inch remains the focus of expansion investment.
Net cash outflow from financing activities was $406.0 million, mainly including repayment of bank borrowings of $569.0 million and interest payments of $37.6 million; meanwhile, bank borrowings of $201.5 million were drawn. The company's cash and cash equivalents at the end of the period were $4.5322 billion, a decrease from $4.8679 billion at the end of the first quarter, but the absolute scale remains relatively ample.
Debt-to-Asset Ratio Decreases, but Increased Short-Term Debt Lowers Liquidity Indicators
As of the end of the second quarter, Hua Hong Grace's total assets were $15.2258 billion, total liabilities were $5.5284 billion, and owners' equity was $9.6974 billion; the debt-to-asset ratio was 36.3%, down 1.6 percentage points from 37.9% at the end of the first quarter.
However, liquidity indicators declined significantly quarter-over-quarter. At the end of the second quarter, total current assets were $6.4210 billion, total current liabilities were $3.1741 billion, and net working capital was $3.2469 billion, lower than $4.7179 billion at the end of the first quarter; the current ratio dropped from 3.4x to 2.0x, and the quick ratio dropped from 3.0x to 1.8x.
The main reason for the rise in current liabilities was that interest-bearing bank borrowings increased from $811.8 million at the end of the first quarter to $1.9021 billion. The company explained that this was mainly due to an increase in the portion of long-term borrowings due within one year.
In terms of inventory, inventory at the end of the second quarter was $584.8 million, up from $533.3 million at the end of the first quarter, mainly due to an increase in work-in-progress; inventory turnover days remained at 84 days. Turnover days for trade receivables and notes receivable were 40 days, a slight improvement from 41 days in the first quarter.
Q3 Revenue Guidance, Huali Micro Integration Enters Advancement Stage
Hua Hong Grace expects that sales revenue in the third quarter of 2026 will be between $770 million and $780 million, with a gross margin between 16% and 18%. Calculated based on the midpoint of the revenue guidance of $775 million, there is still room for quarter-over-quarter growth of about 8.0% compared to the second quarter's $717.5 million.
Management stated that AI continues to drive global semiconductor demand growth, with related demand first reflected in memory chips and gradually expanding to logic and analog chip products related to AI applications. As a specialty process foundry covering multiple end markets, the company has already benefited from this trend.
In addition, Hua Hong Grace recently obtained registration approval from the China Securities Regulatory Commission for the acquisition of Huali Micro. The company stated that after asset integration, it will further strengthen its technology portfolio, enhance operational scale effects, and improve profitability. For Hua Hong Grace, which is still in a stage of high capital expenditure and high depreciation, subsequent capacity utilization, product portfolio upgrades, and integration synergies will be key variables determining whether gross margin can continue to repair.
Updating...
