


Benefiting from AI Demand Spillover, SMIC Q2 Revenue Exceeds $3 Billion, Net Profit Surges Nearly 4-Fold; Q3 Revenue Expected to Rise 2% to 4% Quarter-on-Quarter | Financial Report Insights
SMIC reported Q2 2026 revenue of $3.006 billion, a year-on-year increase of 36.1%, with gross profit margin rising to 25.3% and net profit growing nearly four-fold year-on-year. The performance growth was driven by increased wafer volume and average selling prices, capacity utilization reaching 93.7%, and optimized product mix, as AI demand spread to mature processes, boosting the share of industrial and automotive chips. The company expects Q3 revenue to grow 2%-4% quarter-on-quarter, with gross margin further improving to 26%-28%, marking an upward cycle in performance
SMIC delivered a better-than-expected second-quarter performance: revenue exceeded $3 billion, gross profit margin rose to 25.3%, and profitability improved comprehensively. As AI demand spreads to mature processes, the company's capacity utilization remains high, and its product structure continues to optimize. Management expects revenue and gross margin to further improve in the third quarter.
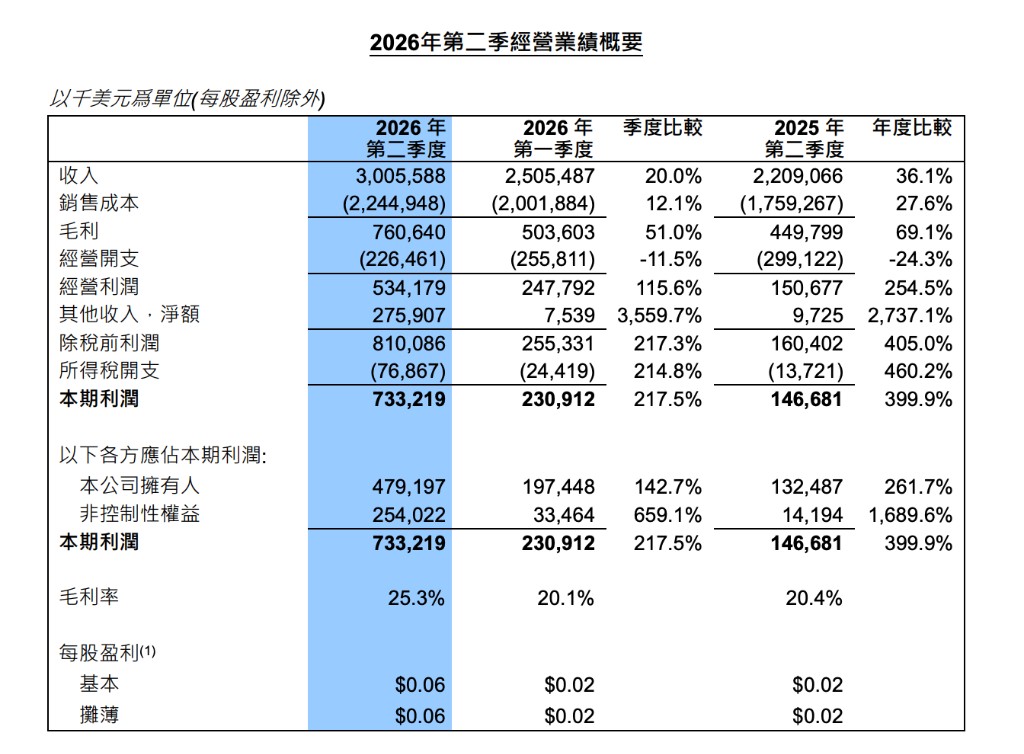
On August 13, SMIC released its unaudited results for the second quarter of 2026. The company's Q2 revenue was $3.006 billion, up 20% quarter-on-quarter and 36.1% year-on-year; gross profit was $761 million, up 51% quarter-on-quarter and 69.1% year-on-year, with gross profit margin rising from 20.1% in Q1 to 25.3%.
Profit growth was even more impressive. Operating profit in Q2 was $534 million, more than doubling quarter-on-quarter and increasing by 254.5% year-on-year**; net profit was $733 million, up nearly four-fold year-on-year.** The company expects Q3 revenue to grow 2% to 4% quarter-on-quarter, with gross margin further rising to 26% to 28%.
Dual Growth in Wafer Sales Volume and Price Drives Steady Q2 Performance Improvement
SMIC stated that Q2 revenue growth was mainly driven by increased wafer sales volume, higher average selling prices, and changes in product mix.
In Q2, the company sold 2.869 million wafers (converted to 8-inch equivalent standard logic), up 14.4% quarter-on-quarter and 20.1% year-on-year; capacity utilization rose from 93.1% in Q1 to 93.7%, higher than 92.5% in the same period last year, continuing to approach full production levels.
Meanwhile, the company continued to expand capacity. Monthly capacity in Q2 increased from 1.078 million wafers in Q1 to 1.097 million wafers (converted to 8-inch equivalent standard logic), with capital expenditures reaching $1.836 billion, up 17.5% quarter-on-quarter.
Increased volume, higher prices, and sustained high capacity utilization were the core factors driving revenue growth.
Improved Product Mix, Rising Demand from Industrial and Automotive Sectors
From the application structure perspective, the share of industrial and automotive chips showed the most significant increase.
In Q2, industrial and automotive revenue accounted for 16.5% of wafer revenue, higher than 14.0% in Q1 and significantly up from 10.6% in the same period last year, indicating continued release of domestic foundry demand in fields such as automotive electronics and industrial control.
Consumer electronics remained the largest application category, accounting for 44.2%, but lower than 46.2% in Q1; the smartphone share further dropped to 16.9%, a significant decrease from 25.2% in the same period last year. The share of computers and tablets rose to 15.6%.
The wafer size structure also continued to optimize. In Q2, the share of 12-inch wafers rose to 78.2%, higher than 76.4% in Q1 and 76.1% in the same period last year. The higher proportion of 12-inch products also became an important factor in the rise of average selling prices.
Significant Gross Margin Improvement, but Non-Recurring Gains Worthy of Attention
In addition to improvements in core business, SMIC's profit in Q2 was also boosted by a substantial increase in other income.
The company's "other income, net" in Q2 was $276 million, a significant increase from $7.5 million in Q1. The main sources included $194 million in share of profits and losses of associates and joint ventures, and other net gains of $63.97 million.
The company stated that some associates are investment funds holding investment portfolios, and significant changes in the fair value of these portfolios this quarter brought considerable gains.
The combined total of these two gains was approximately $257 million. Given their volatility, they should be distinguished from core business performance when assessing the company's core profitability.
On the other hand, Q2 EBITDA reached $2.109 billion, with EBITDA margin rising to 70.2%, significantly higher than 57.3% in Q1 and 51.1% in the same period last year, indicating that scale effects are being further realized.
Parallel Cost Control and R&D Investment Improve Cash Flow
Operating expenses in Q2 were $226 million, down 11.5% quarter-on-quarter and 24.3% year-on-year, with general and administrative expenses reduced by 36.5% year-on-year, demonstrating effective cost control.
While reducing costs, the company continued to increase R&D efforts. Q2 R&D expenses reached $209 million, up 11.5% quarter-on-quarter and 14.6% year-on-year, reflecting continuous investment in technology upgrades and process capability development.
Regarding other operating income, Q2 recorded $113 million, a substantial 91.5% increase quarter-on-quarter and 32.3% year-on-year, mainly benefiting from the recognition of government funds, which provided positive support to operating profit.
Cash flow performance was particularly strong, with net cash flow from operating activities in Q2 reaching $2.522 billion, a significant increase from $685 million in Q1. As of the end of Q2, the company's cash and cash equivalents were $8.216 billion, an increase of $937 million quarter-on-quarter; total liquid funds, including financial assets, amounted to $13.857 billion, basically flat with the previous quarter.
In terms of debt structure, interest-bearing liabilities decreased from $14.512 billion at the end of Q1 to $14.019 billion, with net debt further compressed to $162 million. The net debt-to-equity ratio was only 0.4%, maintaining a robust balance sheet.
AI Demand Spillover Brings New Cycle to Mature Processes
Looking ahead to the second half of the year, SMIC remains optimistic about demand. The company expects Q3 revenue to grow 2% to 4% quarter-on-quarter, with gross margin further improving to 26% to 28%.
Management clearly stated that the industrial promotion and spillover effects brought by artificial intelligence will continue, creating broad demand for integrated circuit manufacturing. The company will flexibly allocate capacity and quickly validate new capacity to help alleviate shortages in the supply chain.
Judging from Q2 performance, the impact of AI demand is spreading from high-end advanced processes to broader mature processes and peripheral chip areas. For SMIC, high capacity utilization, improved product mix, and the release of new capacity are jointly driving performance into an upward cycle.
