


The Optimal 'AI Bubble Trade': Going Long on Both 'Hubris' and 'Humiliation'
Bank of America believes the optimal strategy amid the AI bubble is to go long on both 'hubris' (AI tech) and 'humiliation' (neglected underperforming assets), while shorting AI-related bonds. Although BofA's Bull & Bear Indicator remains in extreme territory, capital is flowing into gold and commodities, with private client equity allocations hitting record highs. Amid debt pressures and yield variables, avoiding the US dollar and bonds remains the main theme
The optimal investment strategy in the current AI bubble environment is to simultaneously go long on "hubris" (leading AI tech companies) and "humiliation" (neglected underperforming assets), thereby capturing two-way gains during the final peak phase of the nominal GDP bubble.
According to Zhuifeng Trading Desk, Michael Hartnett, Chief Investment Strategist at Bank of America Securities, stated in his latest research report that the BofA Bull & Bear Indicator has slightly declined from 9.7 to 9.3 but remains in the extremely bullish range, continuing to maintain a "sell" signal. Meanwhile, capital flows showed structural divergence over the past week: tech stocks experienced their largest single-week outflow in seven weeks, gold saw its largest single-week inflow since January of this year, commodities posted a year-to-date return of 58.9%, while Bitcoin has fallen nearly 28% year-to-date.
BofA pointed out that the core logic of current major asset allocation maintains the framework of avoiding bonds, avoiding the US dollar, and going all-in on AI, further reinforced by policymakers viewing the stock market as "too big to fail." However, strategists also warned that soaring bond yields, a shift in voter sentiment toward caution, and broadly skewed long positions are three potential constraints suppressing the continued rise of the bull market.
"Hubris" Plus "Humiliation": The Optimal Two-Legged Strategy for the AI Bubble
BofA's core trading logic on the AI theme stems from a comparison with historical bubble patterns. The report points out that the optimal bubble trading strategy is to go long on both "hubris"—namely, AI technology itself—and "humiliation"—namely, oversold cyclical assets that have been long neglected by the market and are expected to be lifted during the final peak phase of nominal GDP. Citing historical cases, the report noted that emerging markets during the 1999 internet frenzy and the subprime mortgage crisis from 2007 to 2008 both played the role of "benefiting from spillover effects" just before the dominant bubble reached its peak. BofA believes that in the current environment, the consumer sector is the asset class most likely to replicate this path.
At the same time, BofA recommends shorting AI bonds, arguing that capital expenditure exceeding $1 trillion combined with negative net cash flow means the pressure for large-scale bond issuance cannot be ignored.
Bull & Bear Indicator Remains in Extreme Territory, but Sell Signal Has Limited Impact
BofA's Bull & Bear Indicator dipped slightly from 9.7 to 9.3 this week, maintaining the sell signal, triggered by weakening inflows into high-yield bonds and net outflows from the technology and healthcare sectors. The report pointed out that since the sell signal was issued on May 26 this year, the S&P 500 has cumulatively risen by 4%, and the MSCI World Index has risen by 3%, although there was a maximum drawdown of 5% during the period (from May 26 to July 30, interrupted by US-Japan exchange rate intervention and strong earnings from the Magnificent Seven tech giants).
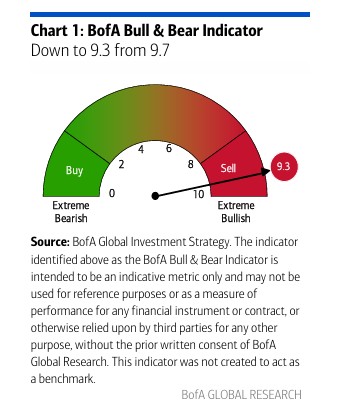
BofA cautioned that overly concentrated positioning can disrupt the rhythm of a bull market, but truly ending a bull market requires the resonance of three elements: excessive positioning, overly optimistic earnings expectations, and policy tightening. Currently, these three elements are not simultaneously present. Historical data shows that since the establishment of the Bull & Bear Indicator, 17 sell signals have been issued. Global stock markets have historically fallen by an average of 2% to 3% within 2 to 3 months thereafter, with a hit rate of about 60%, and maximum drawdowns ranging between 15% and 20%.
Capital Flows: Gold and Commodities Gain Favor, Tech Stocks Sold Off
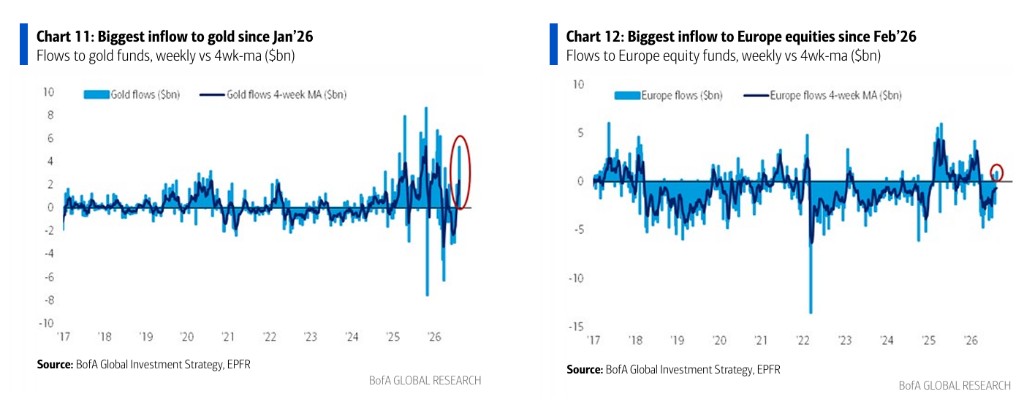
Capital flow data this week showed significant structural divergence. Gold funds recorded a net inflow of $6.3 billion, the largest single-week volume since January of this year; the total year-to-date return on commodities reached 58.9%, ranking first among all asset classes, with crude oil rising 43% year-to-date. In contrast, tech funds saw a net outflow of $1.2 billion this week, the largest single-week outflow in seven weeks. Meanwhile, European equity funds received a net inflow of $1.2 billion, the largest inflow since February of this year; Korean equity funds recorded net inflows for the seventh consecutive week.
In fixed income, investment-grade bonds saw an inflow of $10.6 billion, the largest in five weeks; emerging market bonds saw an inflow of $1.4 billion, the largest in seven weeks. Cash-like assets absorbed $25.4 billion in a single week.
BofA Private Clients: Equity Allocations Hit Record Highs, Cash Drops to Lows
Data from BofA Private Clients shows that assets under management reached $4.7 trillion, with the equity allocation ratio rising to 66.4%, a historic high; bond allocation dropped to 17.0%, the lowest since March 2022; and cash allocation fell to 9.4%, the lowest level on record. Single-week net inflows into equities hit the highest level since September 2022.
Within the bond portfolio, private clients are slightly extending duration, increasing their allocation to 2- to 10-year US Treasuries by 15% year-to-date, while their allocation to Treasury bills with maturities under one year has dropped by over 30% since last November, though interest in 30-year long-term bonds remains lacking. Over the past four weeks, private clients bought Japanese, municipal, and inflation-protected bonds via ETFs, while reducing holdings in emerging market debt, utilities, and financial sector ETFs.
High Debt Pressure, US Treasury Yields Become the Biggest Variable
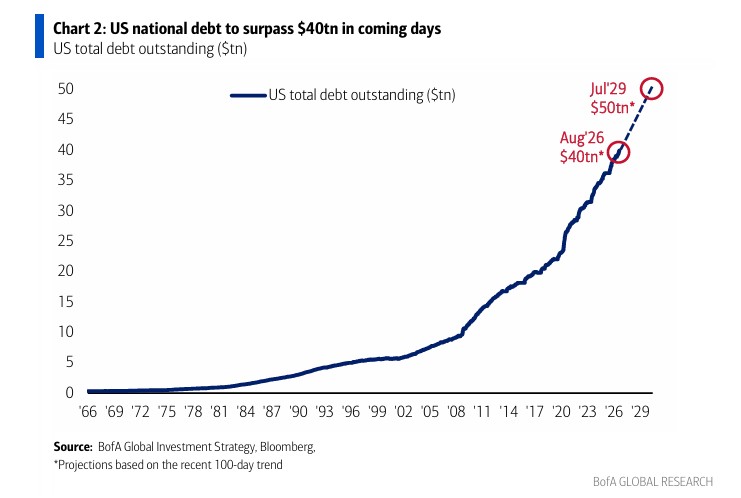
BofA warned that US national debt is about to exceed $40 trillion and is expected to reach $50 trillion by July 2029. The federal government's debt servicing costs over the past 12 months have reached $1.4 trillion, and this cost will continue to rise until the 5-year US Treasury yield falls below 3.25%. Meanwhile, the US 30-year Treasury bond was issued at a yield of 5.126%, the highest in 25 years, yet US stocks simultaneously hit record highs on the same day, highlighting the continued validity of the "avoid bonds" allocation logic.
BofA pointed out that despite the overall upward trend in yields in 2026, long-duration assets previously neglected, such as REITs, small-cap stocks, biotech (XBI), and regional banks (KRE), are quietly outperforming the broader market, reflecting the market's early pricing of expectations that "yields have peaked." The report believes that US-Japan exchange rate intervention has sent a clear signal that the US government does not want the 10-year US Treasury yield to break above 5%. Strategists expect core CPI to fall to the 2.1% to 2.6% range before the midterm elections, at which point hawkish Fed Chair Warsh may declare "mission accomplished" through his Jackson Hole speech and the September FOMC meeting, cooperating with the Bank of Japan's rate hike to jointly cap the upside for yields.
Hong Kong Real Estate and Gold: Two Paths to "Avoid the US Dollar"
Under the theme of "avoiding the US dollar," BofA recommends two specific trading paths. One is to go long on gold, viewing it as the best hedge against US dollar depreciation, bond market collapse, and asset inflation. This week's capital inflows into gold also confirm this market consensus.
The second is to go long on the Hong Kong real estate sector. BofA strategists summarized this logic as "buy humiliation, sell hubris": the Hang Seng Property Index is currently at the same level as 30 years ago, with a valuation of only about 12 times earnings. The report believes that Asia is starting its third long-term bull market in the past 40 years, driven by Japanese and Korean technology and Chinese AI. Hong Kong also benefits from the relative decline in the attractiveness of Dubai (geopolitical conflict) and Singapore (taxation).

November Midterm Elections: The Political Variable Determining Whether the AI Bull Market Can Continue
BofA lists the US midterm elections on November 3 as one of the most critical events affecting market direction. The report points out that if the Republicans hold the Senate and Texas Governor Abbott is successfully re-elected, risk assets led by the AI sector are expected to accelerate towards their peak in 2027; however, if the Democrats take the Senate or the Texas governorship in November, the stock market, the US dollar, and bond yields could all see a sharp drop of over 10% before the end of the year.
The Texas gubernatorial election is seen as a referendum on the route between "affordability" and "AI data centers": the state currently has 335 data centers, with another 247 pending construction. Abbott recently announced a temporary suspension of data center expansion, reflecting voters' concerns about energy grid stability and living costs. In addition, key dates closely watched by BofA include: Warsh's Jackson Hole speech on August 28, the Federal Reserve's FOMC meeting on September 16 (current probability of a rate hike is 35%), and the Bank of Japan meeting on September 18 (probability of a rate hike is 74%).
