


BTIG Warns: Rising Risk of Systemic U.S. Stock Correction from August to October; Now Is the Best Time to Reduce Market Exposure
U.S. stocks are at highs, volatility is extremely low, and investor complacency is rampant—BTIG's Chief Technical Strategist sounds the alarm. Since 1990, the S&P 500 has suffered corrections of at least 7% between August and October in midterm election years without exception. Currently, the deviation of RSP from its 200-day moving average has reached 11%, the VIX is at a yearly low, demand for put protection is near zero, and long-term interest rates are rising against the trend, sending a divergence signal. "The clock is ticking."
The current "atmosphere" in the U.S. stock market is perfect, but historical records are not optimistic.
BTIG's Chief Technical Market Strategist issued a warning in his latest report that the market is entering the year's most dangerous seasonal window—August to October of a midterm election year—with all-time highs and extremely low volatility. He stated bluntly that now is a highly attractive time for investors to proactively reduce market exposure or hedge broad equity positions.
The equal-weight S&P 500 Index (SPW) has risen about 16% year-to-date, with all sectors posting positive returns, indicating that market "breadth expansion" has been achieved. However, historical data shows that since 1990, except for 2006, the S&P index has experienced a correction of at least 7% between August 18 and October 11 in midterm election years. The market is currently entering this period at historical highs, with the VIX at a yearly low and protective demand nearly absent, while multiple technical signals are simultaneously issuing warnings.
Seasonal Patterns: The "Curse Window" of Midterm Election Years
BTIG's data shows that since 1990, the SPW has typically peaked around August 18 in midterm election years, subsequently entering a rather difficult downward phase until mid-October.
In 1990, 1998, 2002, 2010, 2014, 2018, and 2022, corrections of at least 7% occurred during the August to October period. In 1994, the decline was 5%, but it further expanded to 8% by December of that year. The only exception was 2006, but that year had already recorded a 9% drop from May to July, which in a sense merely shifted the adjustment period earlier.
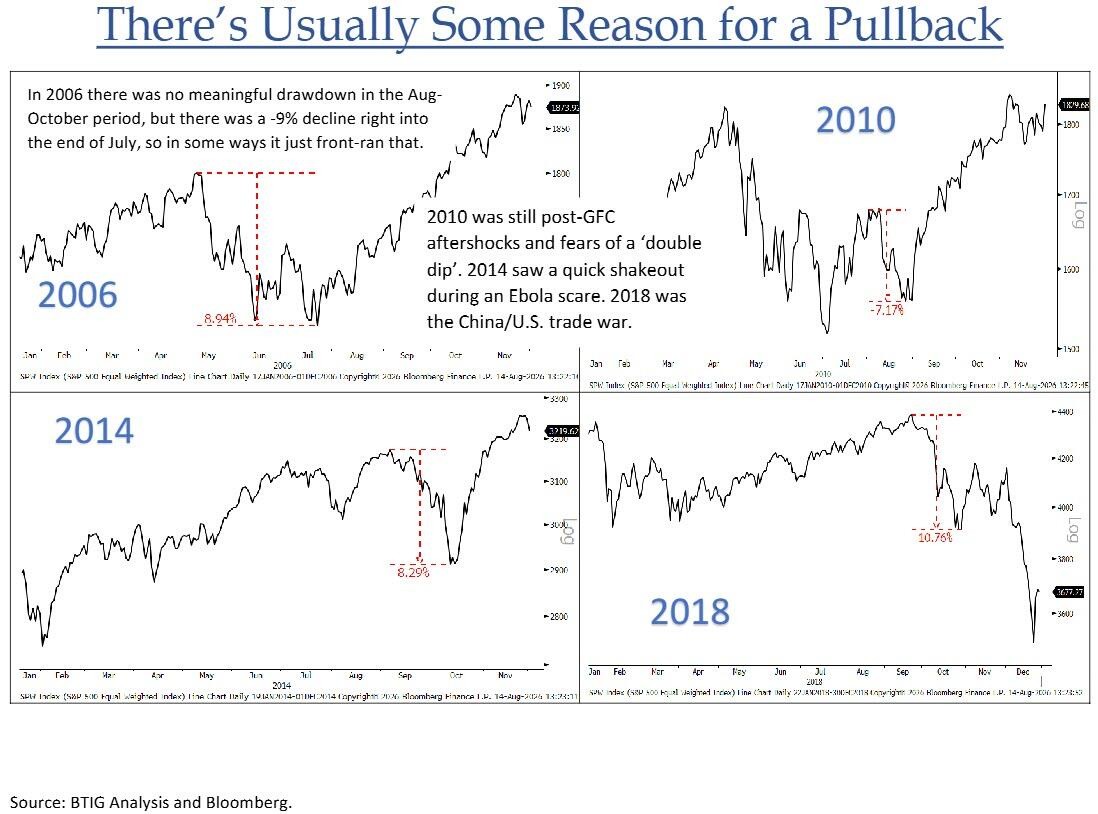
It is worth noting that midterm elections themselves are not always the direct cause of volatility. BTIG points out that it is often an unknown external event that triggers the decline—such as the invasion of Kuwait in 1990, the Long-Term Capital Management (LTCM) crisis in 1998, and the Ebola outbreak in 2014. This means that the potential risks facing the current market are equally difficult to predict.
Technical Analysis: Multiple Indicators Simultaneously Flash Yellow Lights
In addition to seasonal patterns, several current technical indicators point to rising market fragility.
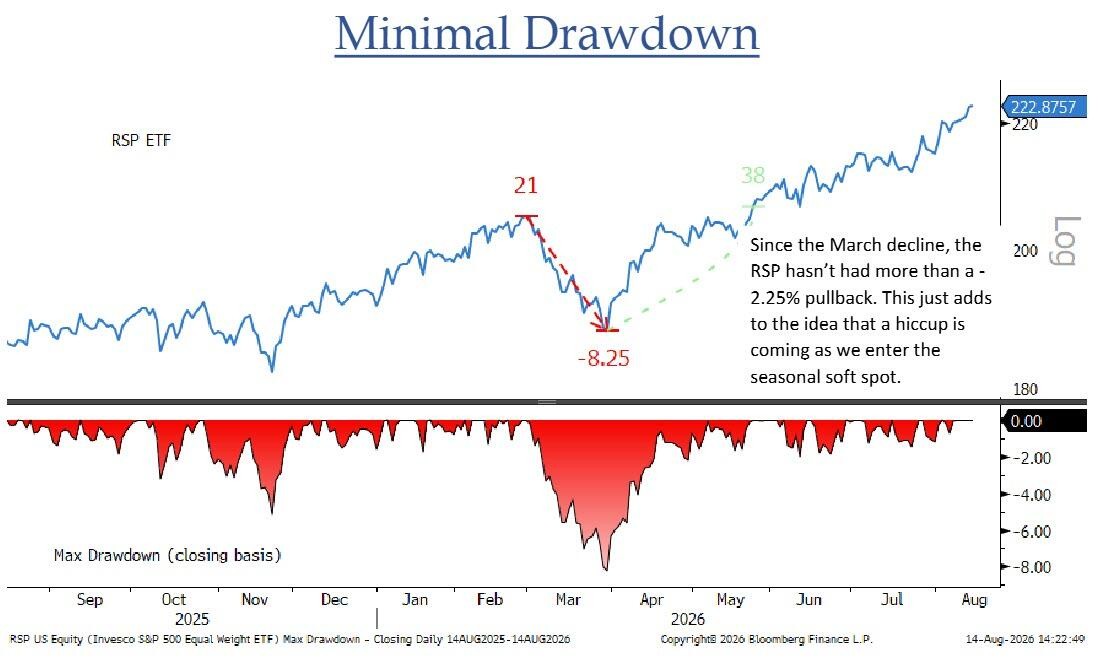
Since the March correction, the maximum drawdown of RSP (Invesco S&P 500 Eq Wgt ETF) has not exceeded 2.25%. This unusual calmness itself is a signal of accumulating risk. Meanwhile, the current price of RSP is about 11% above its 200-day moving average. BTIG notes that, excluding the special market conditions following the pandemic, the deviation of RSP from its 200-day moving average usually does not exceed current levels. Although the trend is strong, the extent of the stretch is at a historical high range.
The absence of downside volume signals is also noteworthy. Year-to-date, the NYSE has not seen a single "80% downside volume day"—a trading day where downside volume accounts for more than 80% of total volume. The historical average is 21 such trading days per year, and since records began in 1996, no year has had fewer than five. BTIG states that the current streak without an 80% downside volume day is the longest on record, with a significant margin.
Sentiment: Market Demand for Protection Drops to Extremely Low Levels
Investors' disregard for downside risk is also reflected in the options market. The 10-day moving average of the CBOE Put/Call Ratio has dropped to 0.82, sitting in a low range seen over the past few years, indicating that market participants have hardly purchased protection against potential corrections.
BTIG lists this phenomenon alongside the market being at historical highs and the VIX at a yearly low, believing that these three factors together constitute a complete picture of the current high level of market complacency.
Anomaly in Long-Term Interest Rates: Bond Market Sends Divergence Signal
A worrying divergence has also appeared at the macro level. Despite non-farm payrolls, CPI, PPI, and retail sales data all showing dovish characteristics over the past week, U.S. long-term Treasury yields closed near the highest levels of this cycle.
This movement, where "interest rates ignore positive data," forms a clear contradiction with the current optimistic pricing in the stock market, further increasing market uncertainty.
Regarding sector allocation, BTIG points out that historical data shows the healthcare sector performs relatively resiliently from August to October in midterm election years, offering some defensive value.
In semiconductors, the Philadelphia Semiconductor ETF (SOXX) faced precise resistance at its 50-day moving average. BTIG believes this aligns with the initial rebound pattern after a "boom/bust top" and expects it to continue seeking a bottom at the 200-day moving average within the year. Although the energy sector has seen a multi-month breakout, BTIG remains cautious about chasing the rally, believing that a single headline news item could reverse the uptrend, and does not recommend actively buying at highs.
BTIG strategist Krinsky concludes that now is an excellent time to reduce risk or hedge broad equity exposure, as "the clock is ticking."
