
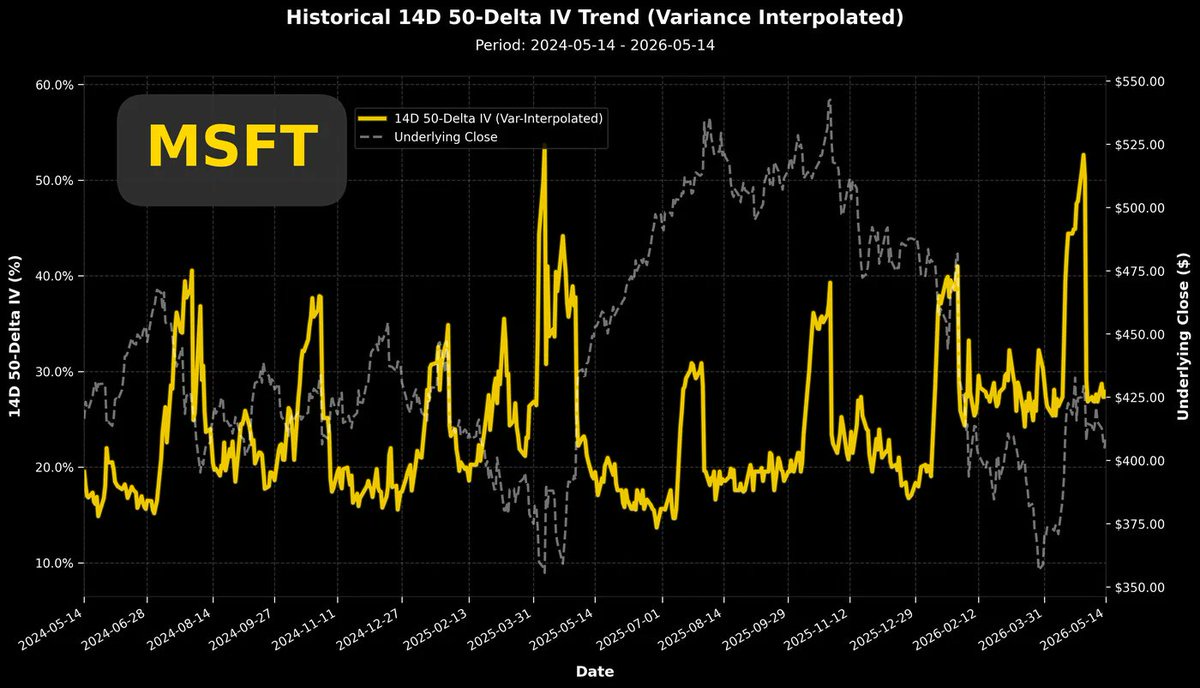
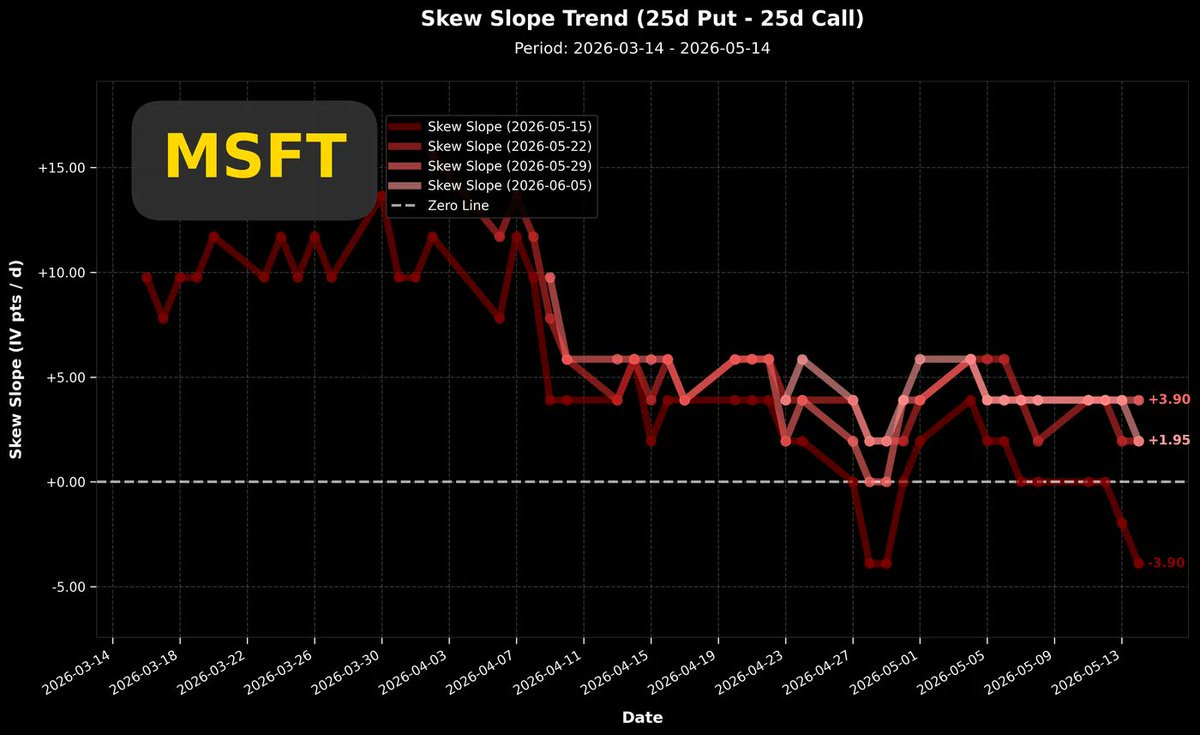
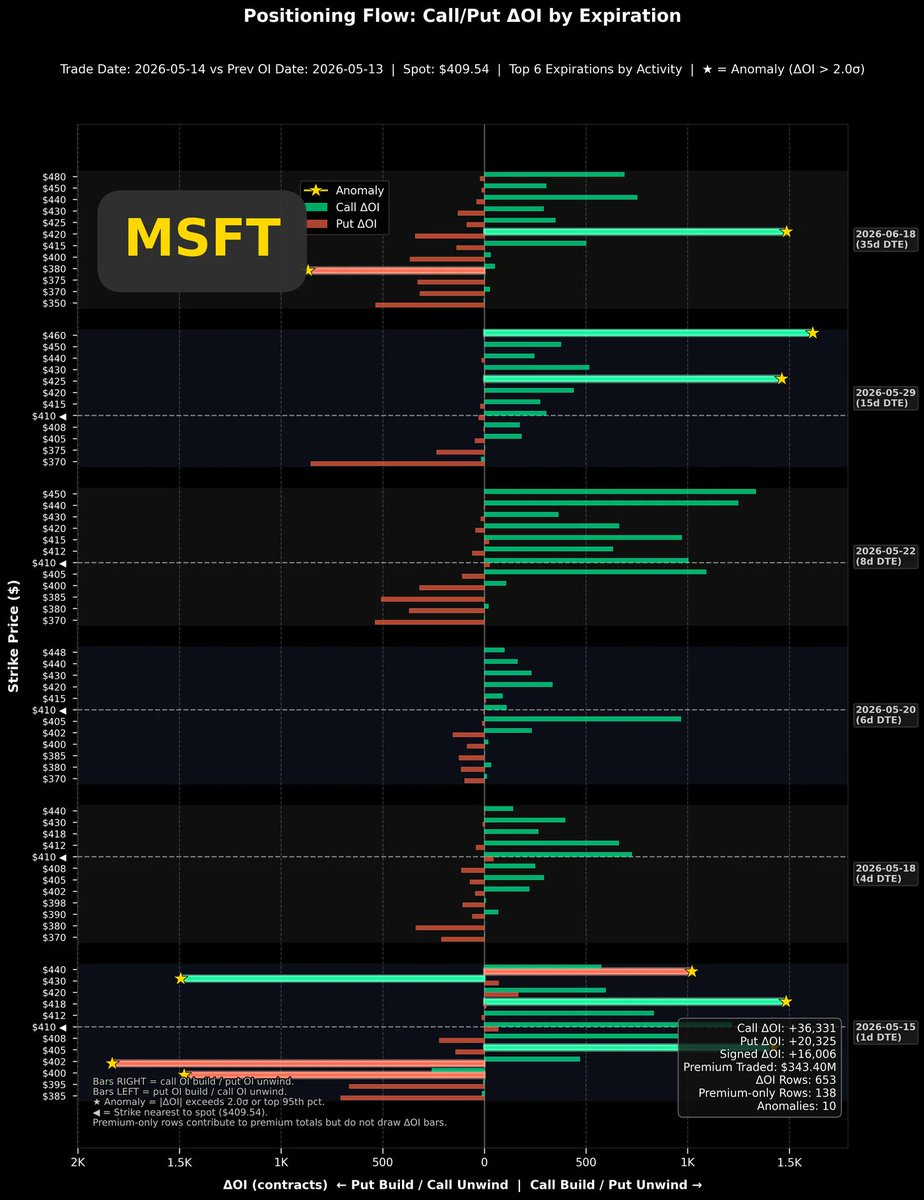
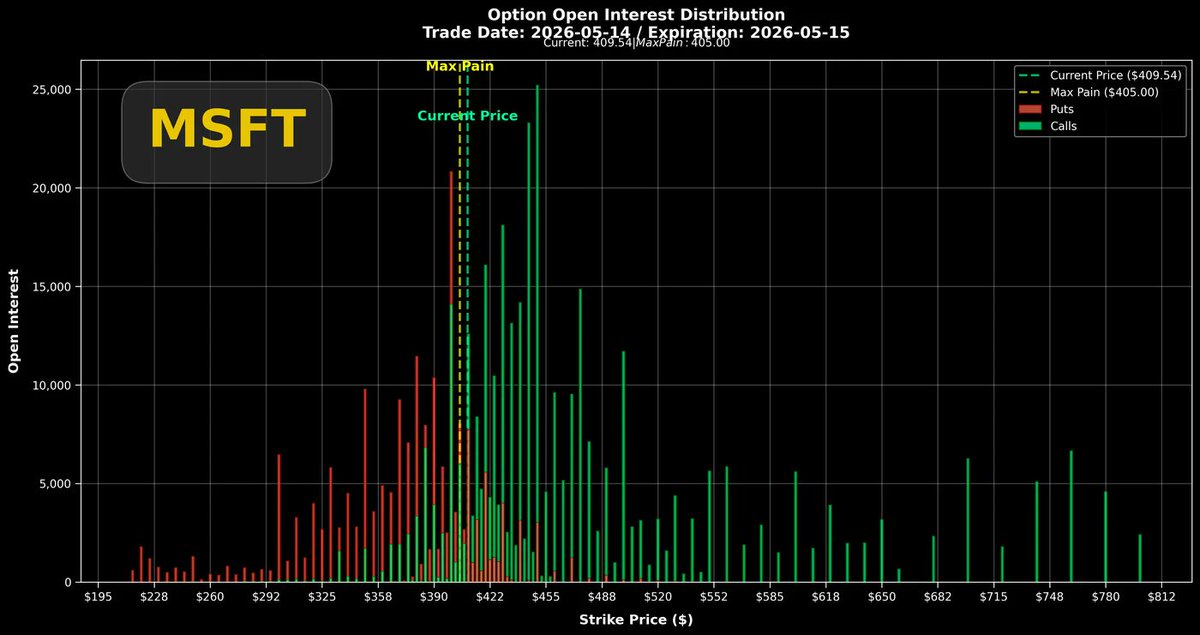
After Microsoft's earnings report, the implied volatility directly returned to the pre-earnings benchmark level in a single day (top-left chart), which is a very common behavior. However, what is puzzling is that perhaps due to the bullish enthusiasm in other tech stocks, the Put/Call volatility spread for $Microsoft(MSFT.US) (top-right chart) has consistently shown a lack of interest in building positions for put options, with the focus always on call options. $Microsoft(MSFT.US)'s stock price has been consolidating weakly for some time, but the bulls have not given up. You can see in the top-right chart that since April 10th, the volatility spread has been closer to the zero line than the usual benchmark. In the last three trading days, even options expiring on May 15th have a volatility spread below the zero line. The market participants' enthusiasm for call options can also be seen in the bottom-left chart, the single-day position change chart, which shows a large number of call options, regardless of expiration date, actively opening new positions across a wide range of strike prices. If we look at the cumulative position distribution chart for this Friday's expiration, we can see that the number of green bars representing call options is significantly higher than the red bars representing put options. Although the maximum pain point price is close to the stock price, the accumulated volume of call options in the upward direction is not to be underestimated. These active bullish forces have become unusually firm after the earnings report, and the real reason is puzzling.
The copyright of this article belongs to the original author/organization.
The views expressed herein are solely those of the author and do not reflect the stance of the platform. The content is intended for investment reference purposes only and shall not be considered as investment advice. Please contact us if you have any questions or suggestions regarding the content services provided by the platform.
