
Descending wedge pattern in K-line chart

In candlestick analysis, a falling wedge is a common reversal or continuation pattern, usually appearing in a downtrend, suggesting that prices may soon reverse upwards. It consists of two converging trend lines, resembling a downward-sloping wedge.
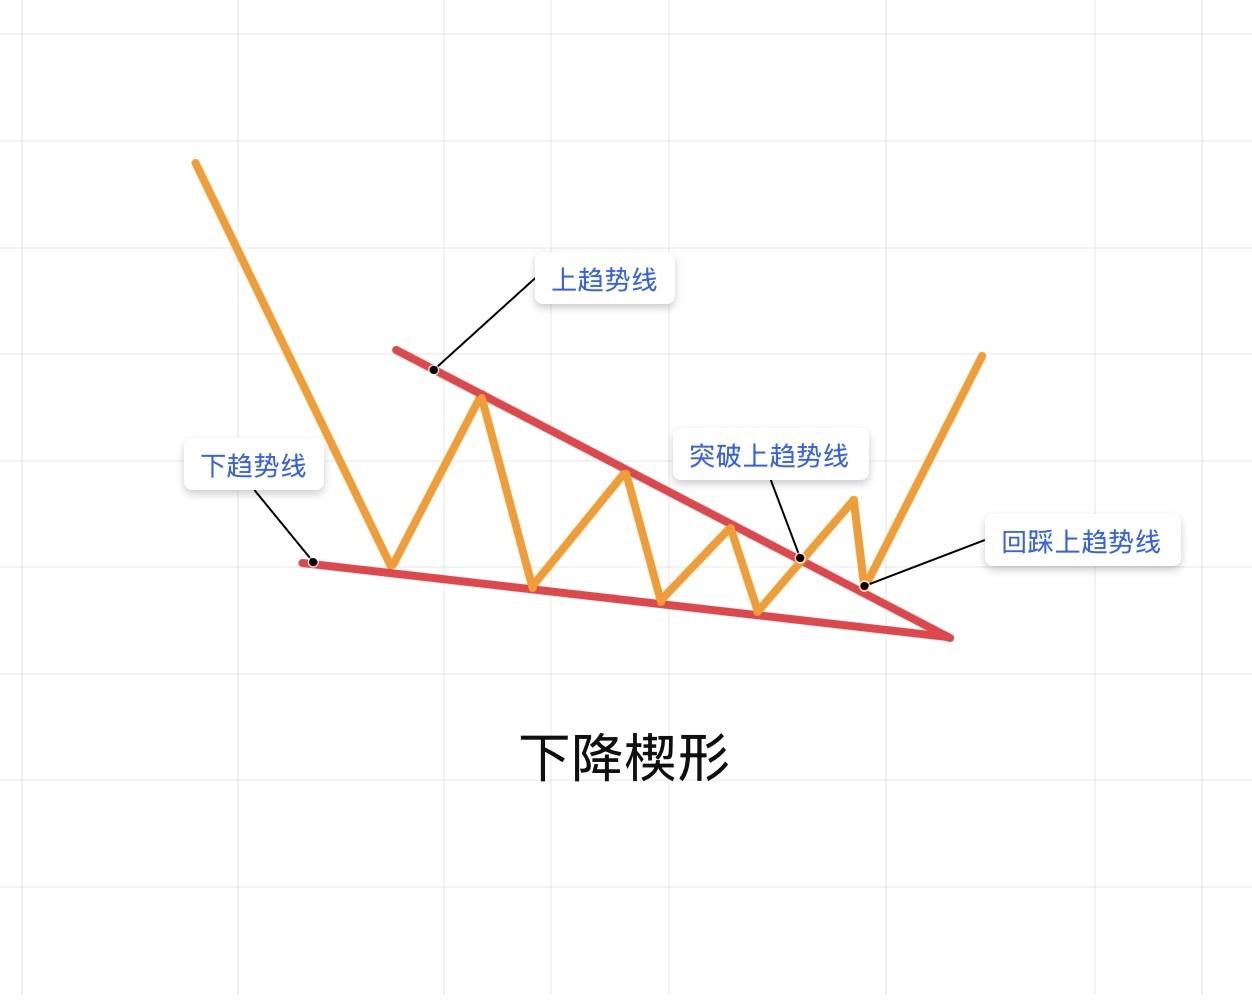
Pattern composition:
- Upper trend line: Connects lower highs of price fluctuations, sloping downward.
- Lower trend line: Connects lower lows of price fluctuations, sloping downward and converging with the upper trend line.
- Convergence feature: The distance between highs and lows gradually narrows, and the volatility weakens.
Trading signal:
When the price breaks above the upper trend line, it indicates increasing buying power, and bulls may take over, presenting a potential buy signal. After the breakout, the upper trend line may turn into support.
A falling wedge does not always signal a reversal; sometimes, it may just be a correction within a downtrend. Observing the breakout direction and trading volume can help you more accurately judge the trend.
"This article is only an example for candlestick learning and does not constitute investment advice."
The copyright of this article belongs to the original author/organization.
The views expressed herein are solely those of the author and do not reflect the stance of the platform. The content is intended for investment reference purposes only and shall not be considered as investment advice. Please contact us if you have any questions or suggestions regarding the content services provided by the platform.
