
Asset Carnival! Will 2026 Really Enter the "Nixon Era"?
Hello everyone, I am Dolphin Research!
With an imminent rate cut, global assets are already in a frenzy. In this week's strategy report, we will connect the clear 'underlying thread' behind Trump's 'chaotic' moves:
1. U.S. Treasury Bonds Up, U.S. Stocks Up? A Precise Interpretation of Soft Landing Expectations
Facing the recent U.S. economic scenario of rising inflation vs. declining employment, it seems that U.S. Treasury bonds are starting to trade on weakening employment, anticipating a rate cut, while U.S. stocks are surging, pricing in an economic rebound post-rate cut.
These two seem to be trading on completely different economic fundamentals, but essentially, both are pricing in a non-recessionary, better future economy.
Moreover, the data released last week seems to confirm this trading combination:
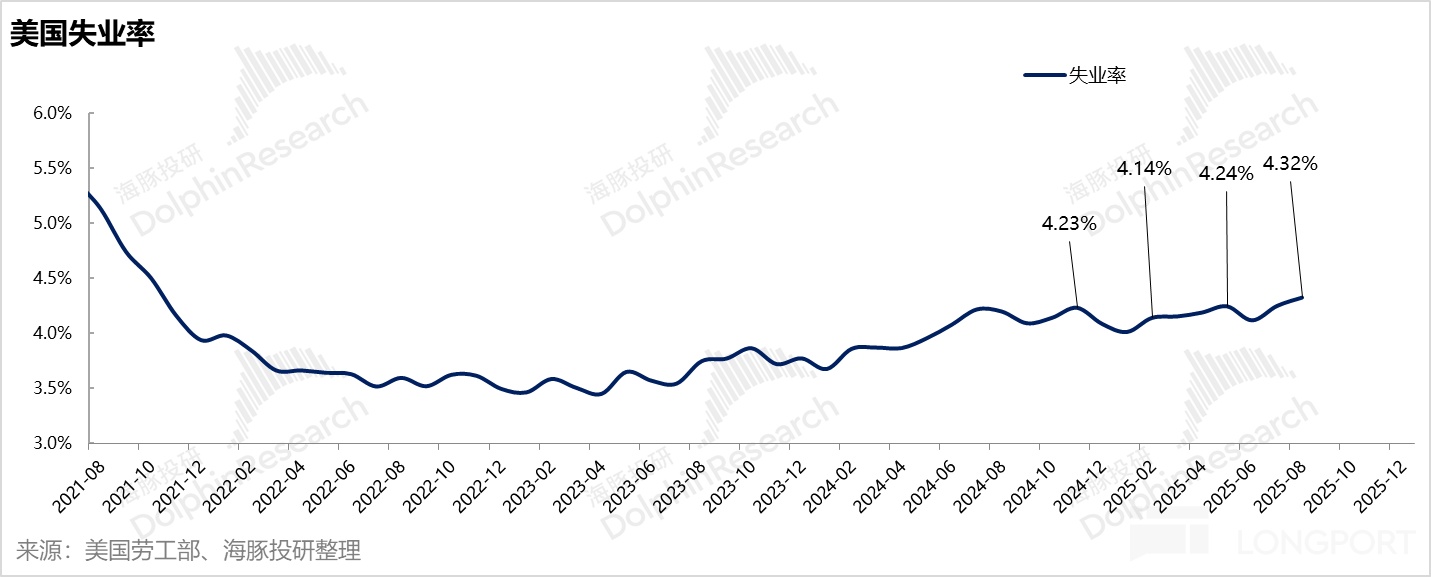
First, last year's new employment was ultimately revised down by over 910,000, more than the previously forecasted 800,000 by Bespoke, exceeding market expectations. However, this revision, with the unemployment rate still around 4.3%, only indicates that employment was not as good as initially thought, but it is not chaotic unemployment, and the rate cut is still a 'preventive rate cut.'
Regarding the upcoming Federal Reserve meeting, such a revision is unlikely to change the Fed's original plan to cut rates by 25 basis points to a 50 basis point cut, but it may provide the Fed with 'effective data support' to further soften its stance, or in other words, to further consider employment in its strategy, as previously mentioned by Dolphin Research, precisely feeding the Fed's decision-making system, facilitating the Fed's smooth evolution towards a 'dovish' direction.
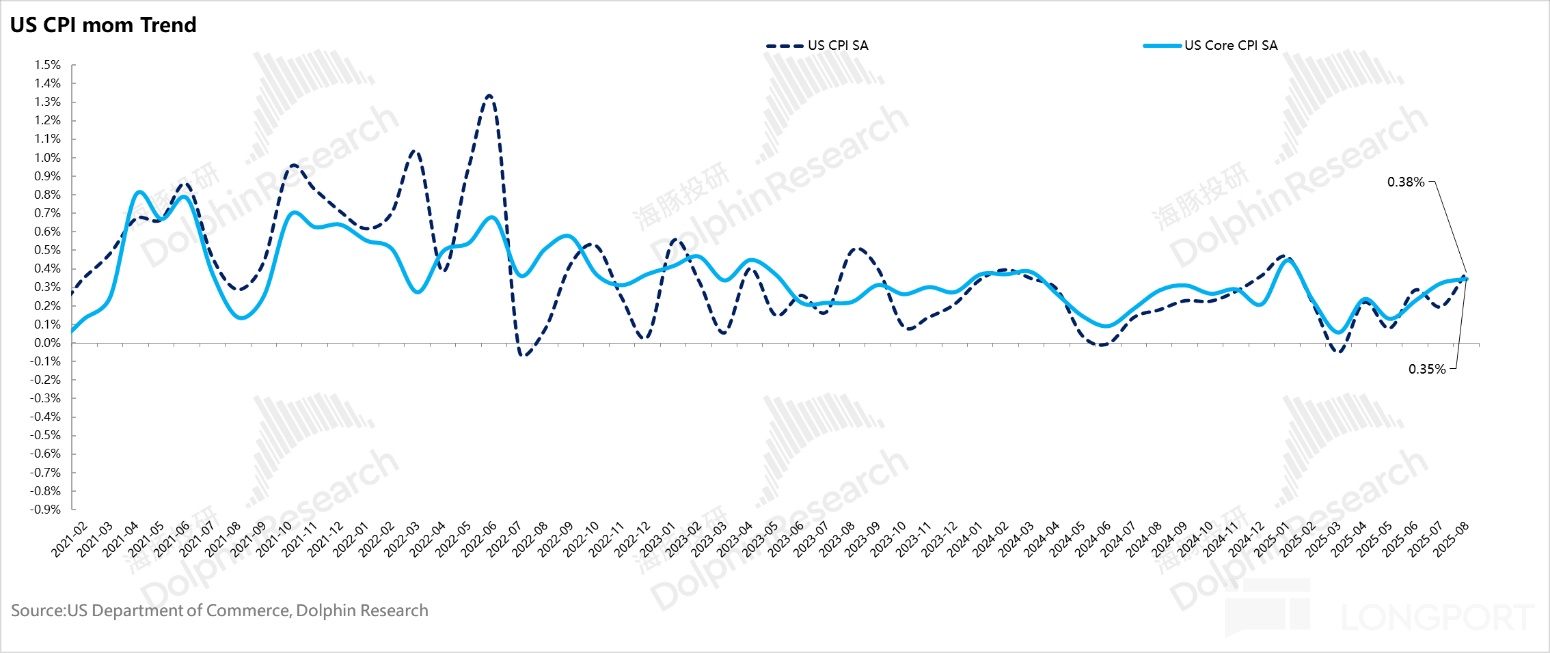
Besides employment, the core CPI for August, released last week, is a key indicator to observe whether tariffs have permeated the real economy. The result is a month-on-month increase of 0.35% (if this growth continues every month, the year-on-year CPI will be 4.3% a year later), which is still relatively high.
However, a detailed look at this data shows that core goods increased by 0.3% month-on-month from the previous month's 0.2%, and the overall price expansion in categories most directly affected by tariffs is not exaggerated. Instead, core services, less related to tariffs, increased from 0.2% to 0.4% month-on-month, mainly due to the month-on-month increase in owners' equivalent rent in housing costs.
In other words, although the core CPI in August is still running high at 0.35%, it looks more like endogenous inflation rather than exogenous inflation directly caused by tariffs. The logical chain (self-persuasion of decision-makers) in this case is very perfect:
a. The risk of exogenous inflation caused by tariffs is not significant, qualitatively more of a one-time external factor;
b. Endogenous inflation, with slowing employment, has a low risk of a wage-inflation spiral.
Therefore, in this case, it is entirely reasonable for the Fed to shift its decision-making balance towards employment and preemptively cut rates, ensuring a perfect economic landing.
2. Is the Current U.S. Economy Really Weakening? Actually, It's Not Bad
At the same time, considering that employment data has been revised to a 'dismal' state, let's look at two other data points:
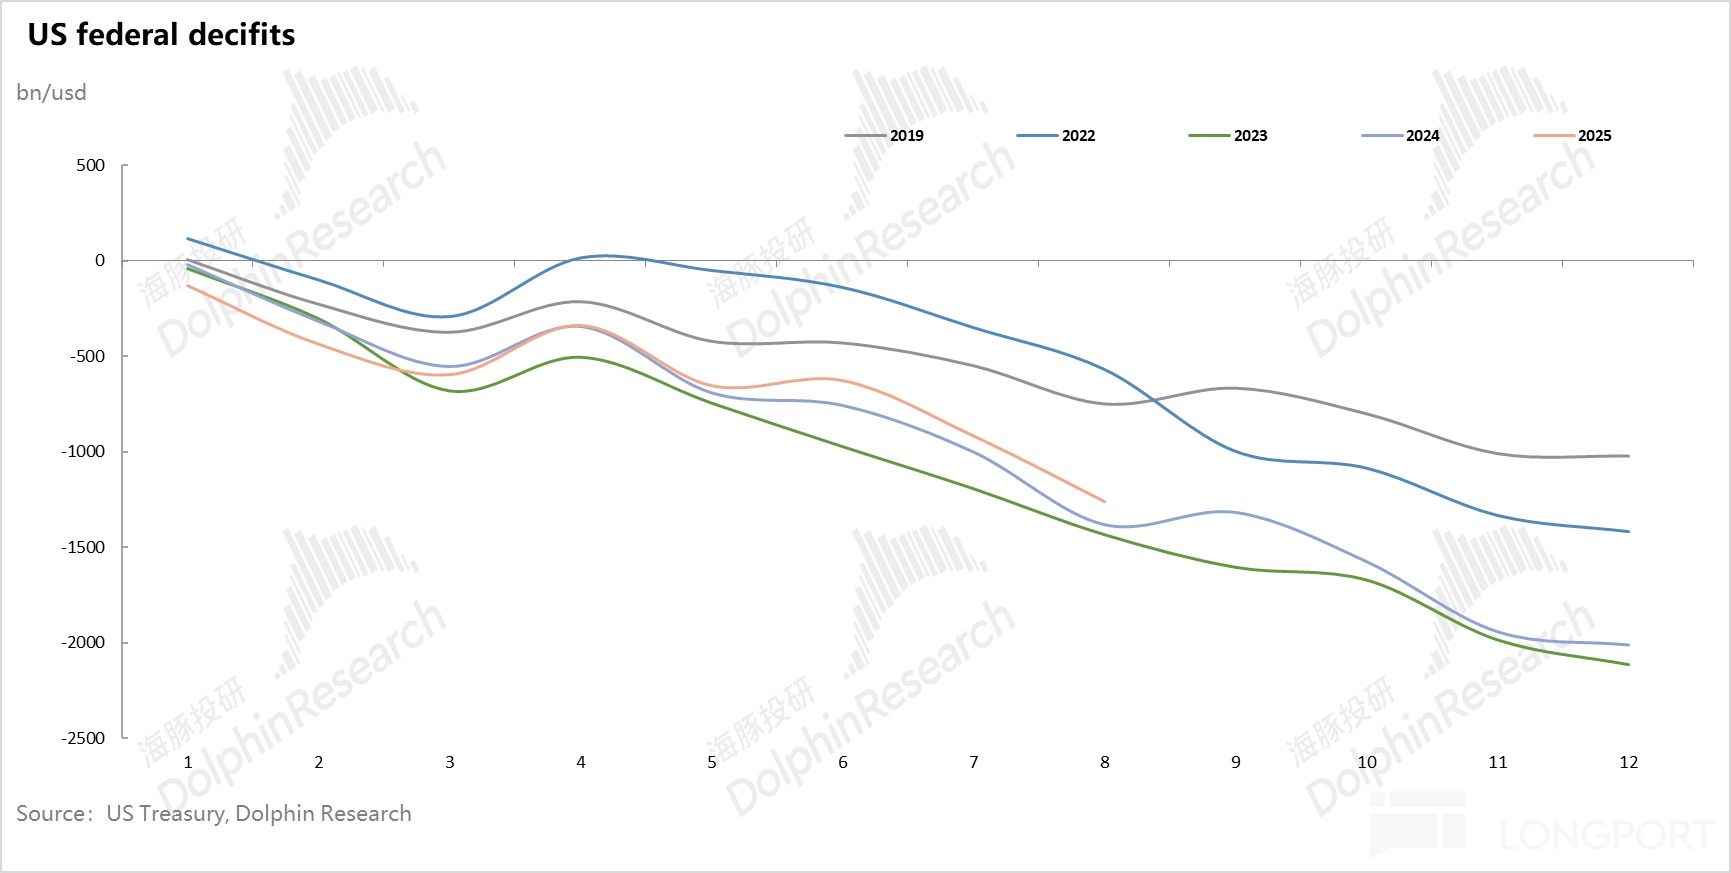
1) The scale of U.S. fiscal stimulus in 2025: As of August this year, the U.S. federal fiscal deficit is indeed lower than in 2024, with a second-quarter deficit rate of 3.1% excluding interest payments, down from 3.6% in the same period last year. However, this deficit level is still relatively high compared to the normal economic period before the pandemic, and fiscal support for the economy has not significantly decreased.
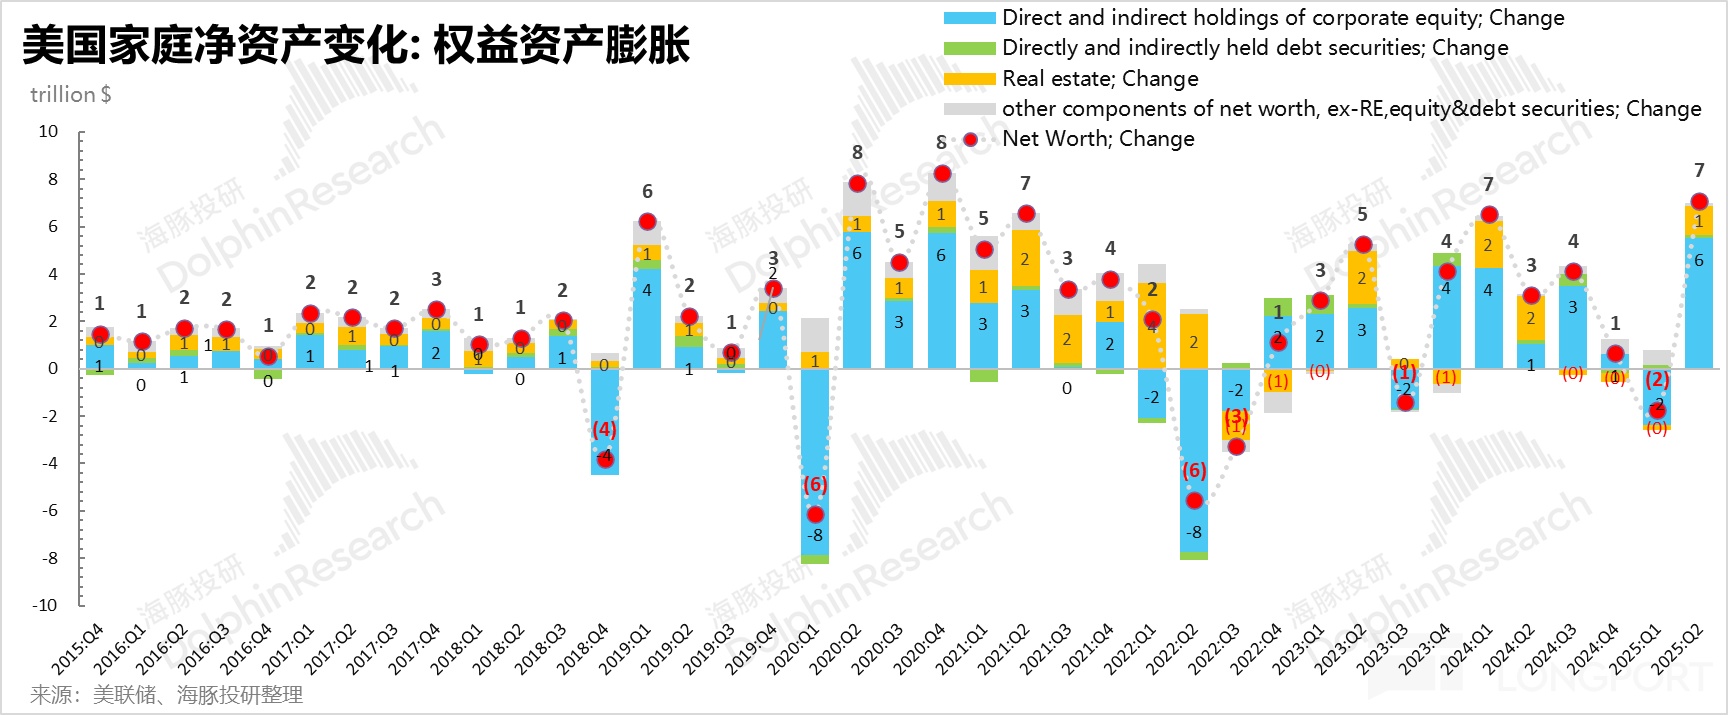
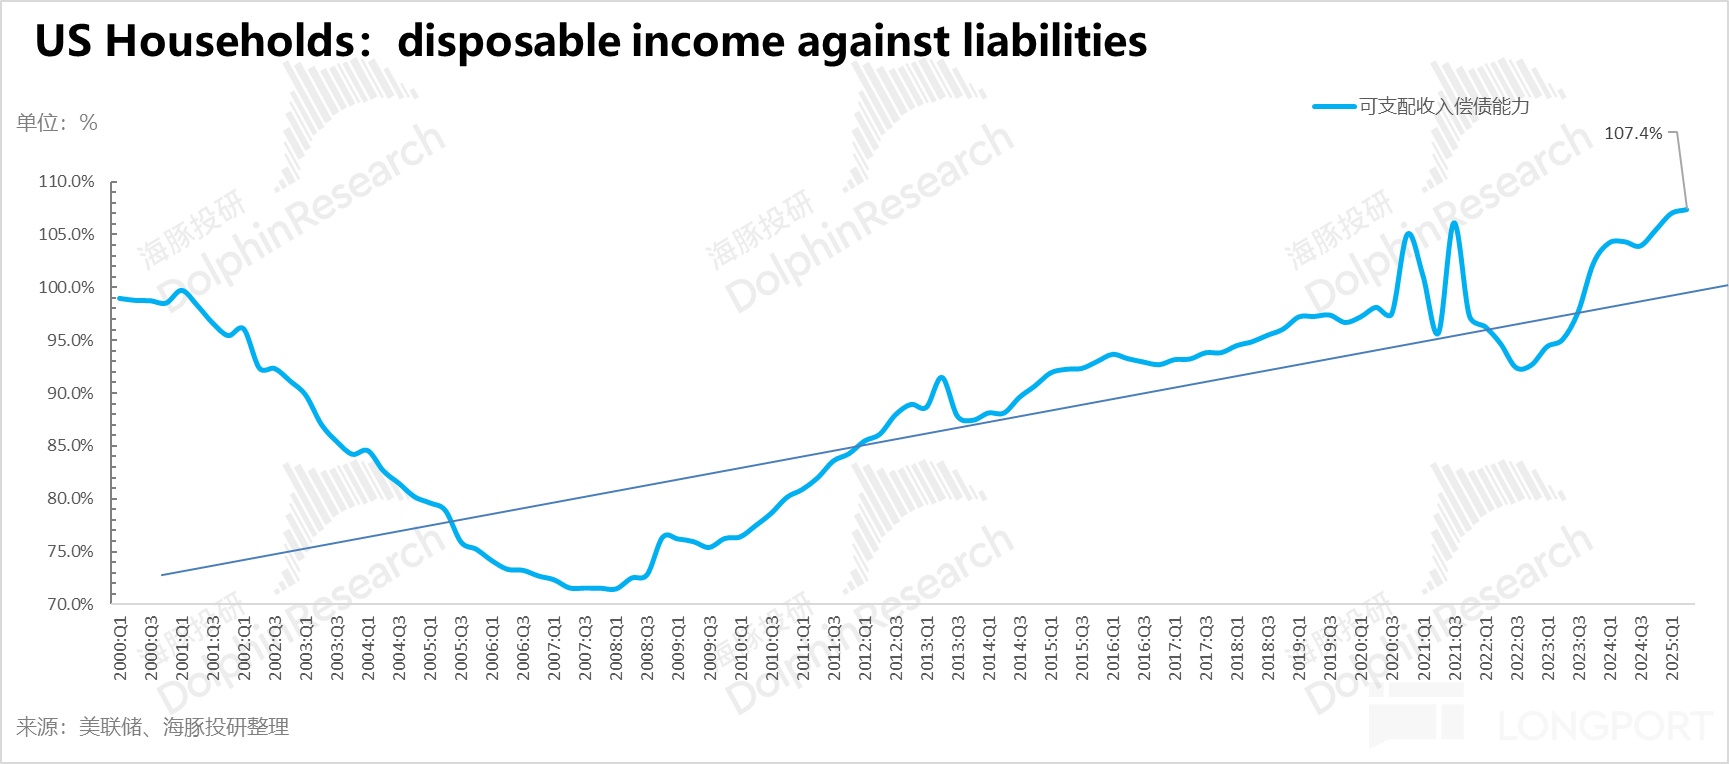
2) The wealth effect of residents is still present: In the second quarter, residents' equity investments significantly appreciated again after further climbing following adjustments in U.S. stocks, with household net assets quickly rebounding and reaching new highs; residents' disposable income relative to household debt repayment capacity reached new highs, and the leverage ratio of residents further declined, maximizing the wealth effect and further consolidating residents' sense of security.
As the main driver of U.S. domestic demand growth, the sustained wealth effect of assets naturally encourages residents to spend, effectively boosting U.S. domestic demand.
This macro combination results in a current scenario of stable domestic demand from residents + corporate investment demand driven by AI; and looking forward, 2026 will still be a combination of loose monetary policy + active fiscal policy.
This combination, especially starting rate cuts without effectively curbing inflation, in the context of a weakening dollar, will be beneficial for global assets.
3. 2026: Returning to the Nixon Era?
Obviously, the economic outlook for 2026 has only one core issue left: economic growth is good, but starting rate cuts without controlling inflation, will it backfire?
Dolphin Research's observation on this issue is: backlash may come, but at the point of the midterm elections faced by the Republican Party in 2026, this risk is actually not significant, especially with the current U.S. White House able to pressure the Fed to adjust policies, it is hard to rule out that the White House will have actual price control policies, making 2026 look like a 'best year.'
And this price control already has signs:
a. Energy: Striving to quickly end the Ukraine war, increasing traditional energy exploration and development in the U.S.;
b. Healthcare: Lowering U.S. drug prices to 'most favored nation' levels;
c. Housing: U.S. government officials are currently evaluating whether to declare a 'national housing emergency' to address declining housing affordability;
d. Utilities: Trump vowed during his campaign to halve U.S. domestic electricity prices within 12 months of taking office, especially in the context of the current government's encouragement of the AI industry, which has a strong demand for electricity.
Strong control of the Fed + indirect price control, this combination looks like what? In Dolphin Research's view, it seems very much like a flashback to the Nixon era. Everyone knows about the runaway inflation of the Nixon era, but that's the second half of the story. The first half of the story is that Nixon, through controlling the Fed + controlling prices, achieved price control and economic prosperity in the first two years of the 70s with a 'visible combination of iron fists.'
And now, the 'second half of Nixon' has not yet arrived, so the market naturally focuses on the trading opportunities brought by the 'prosperous economy' in the first half of the story, with the entire trading opportunity leaning towards the 'policy market' dominated by Trump's policies—whichever industries the White House policies encourage, those industries will have excess investment opportunities; and whichever industries' prices he wants to control, those industries will find it hard to outperform the market.
Moreover, in 2026, with the big logic of ensuring the midterm elections, the chance of encountering a major negative impact from Trump's policies, similar to the big pit created by tariffs in the first half of this year, is actually not significant.
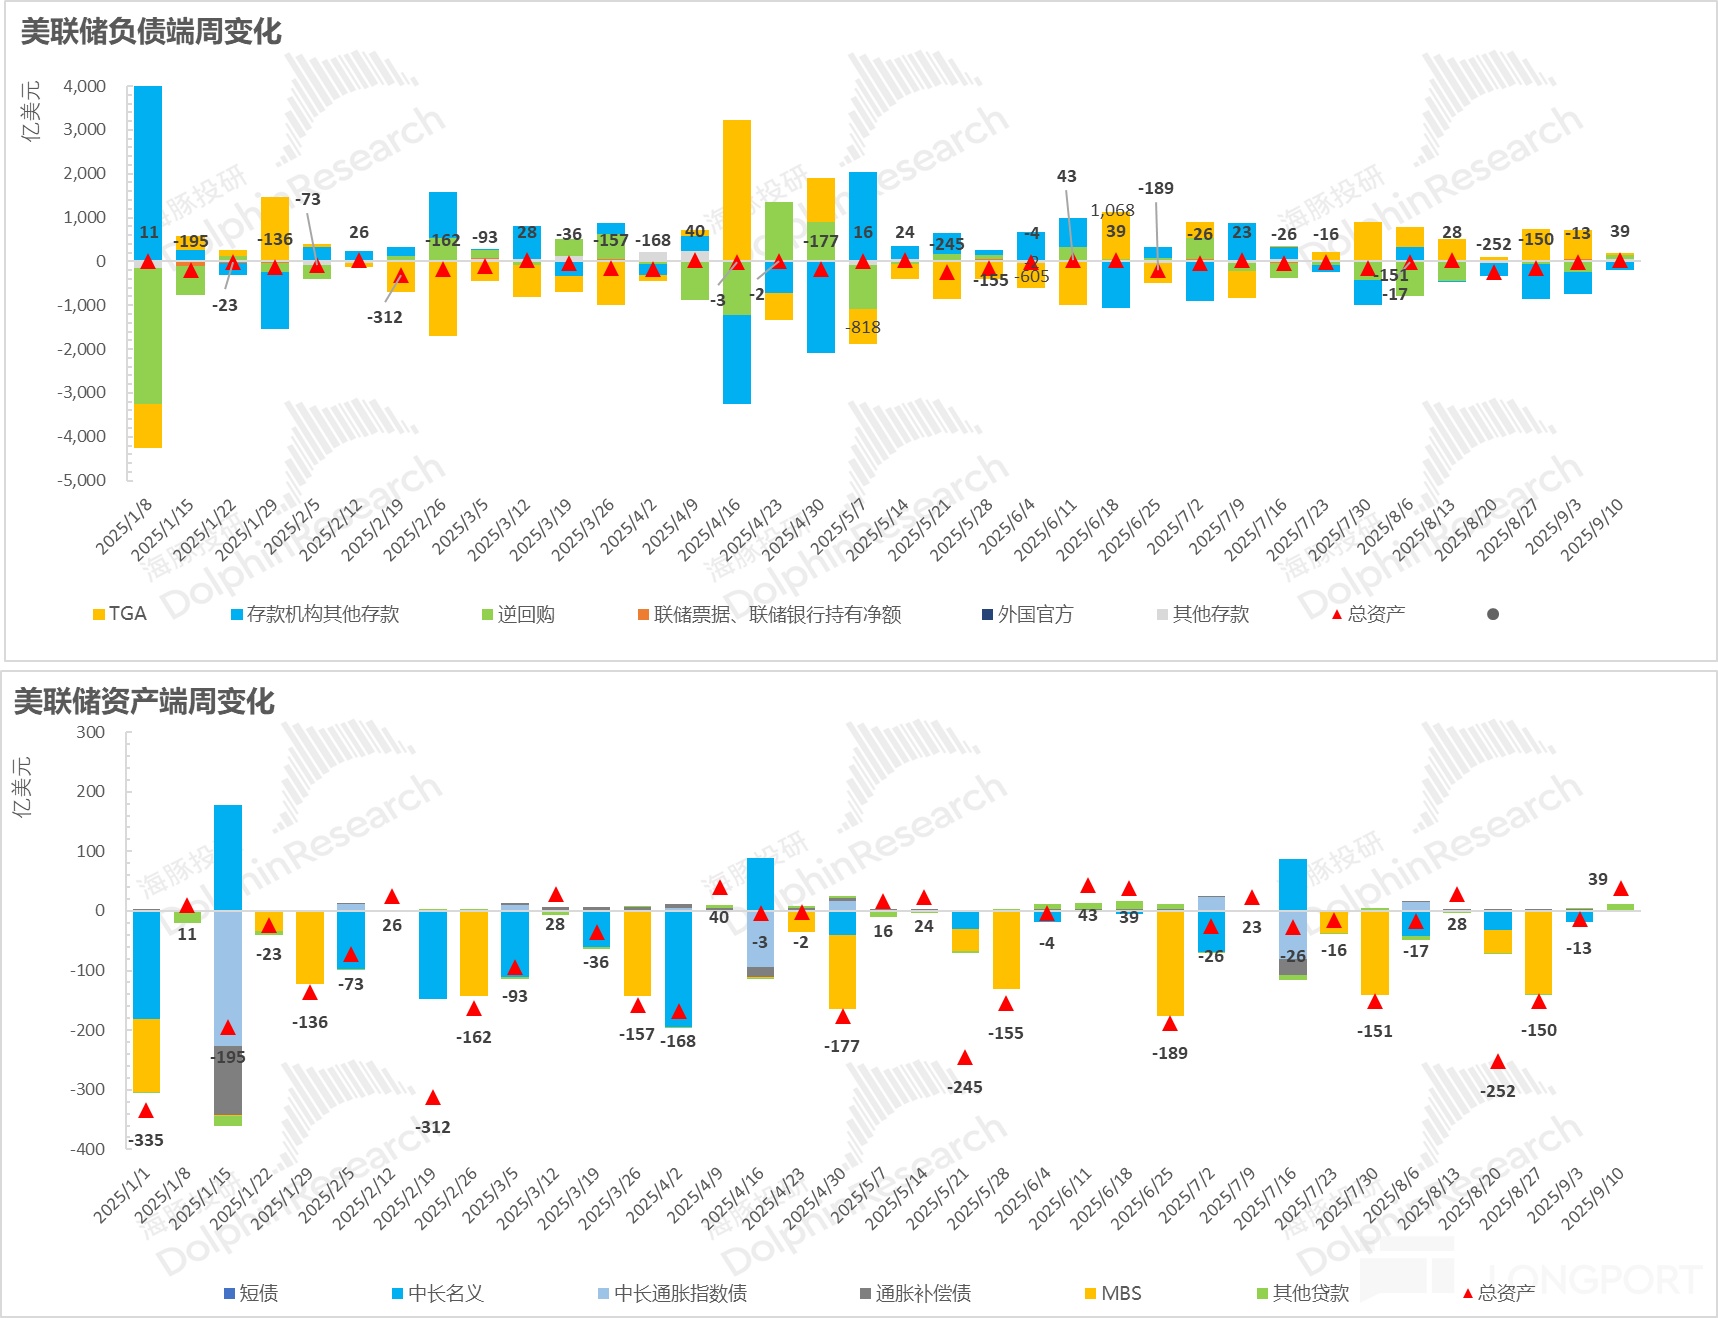
In the short term (in September), the small liquidity shock brought by bond issuance, and this shock was not obvious last week: The Treasury Department slowed down the pace of bond issuance to rebuild the TGA account in the past week, with the TGA balance rebuilt to $667.5 billion as of the week ending September 10.
Since the balance needs to reach $850 billion by the end of September, the remaining time in September will still need to continue absorbing market liquidity, instead creating an opportunity for the market to find quality companies that are not overpriced.
In terms of overall direction, Dolphin Research believes that it can revolve around: a. Encouragement of Trump's policies; b. Rate cuts increasing the elasticity of small-cap stocks; c. Rate cuts weakening the dollar, driving opportunities for emerging assets outside the U.S., and of course, Hong Kong stocks will also benefit in this process.
4. Portfolio Returns
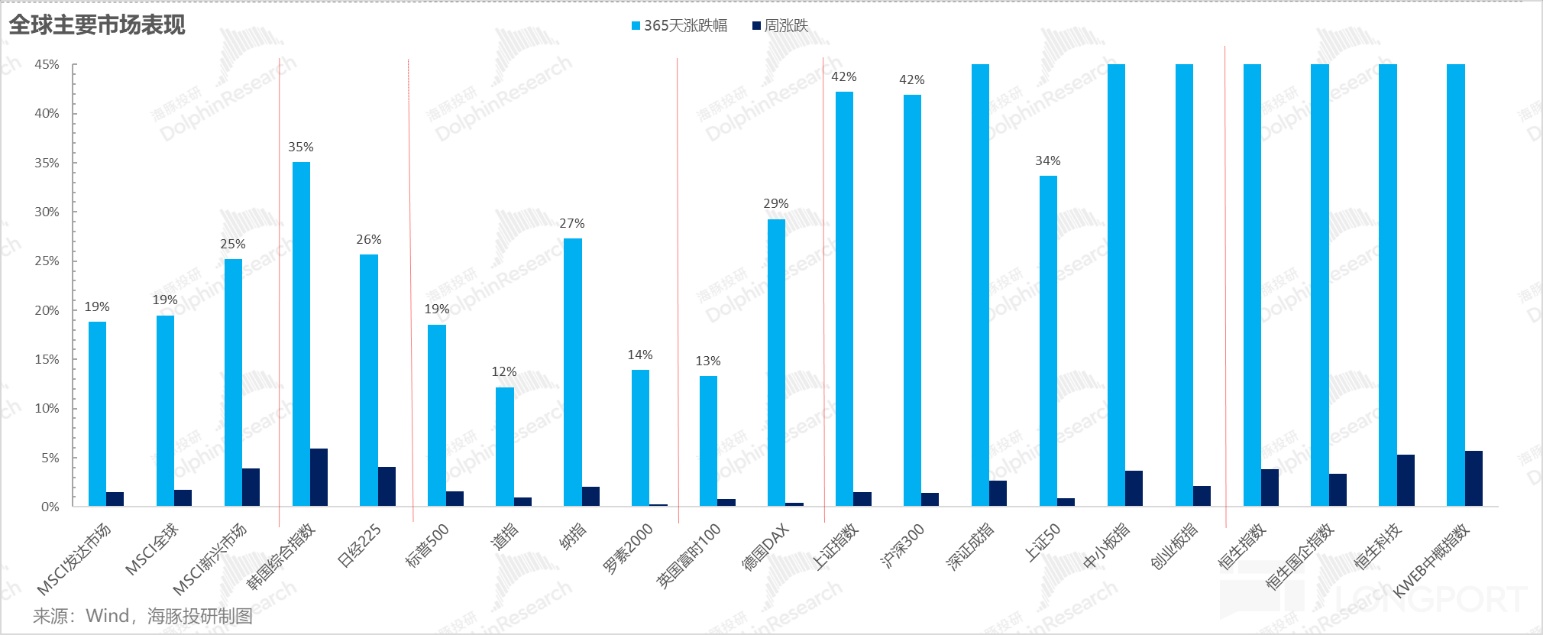
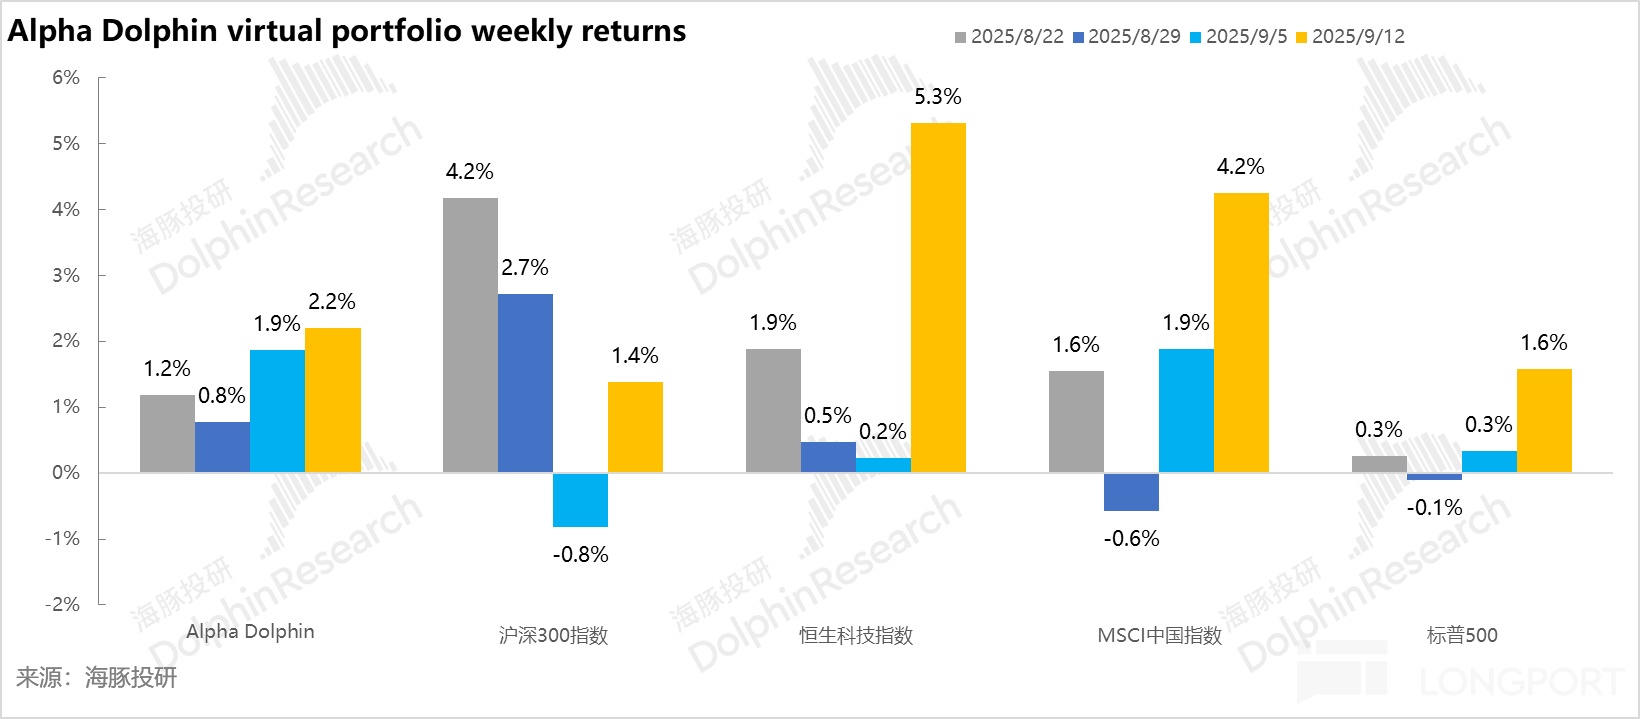
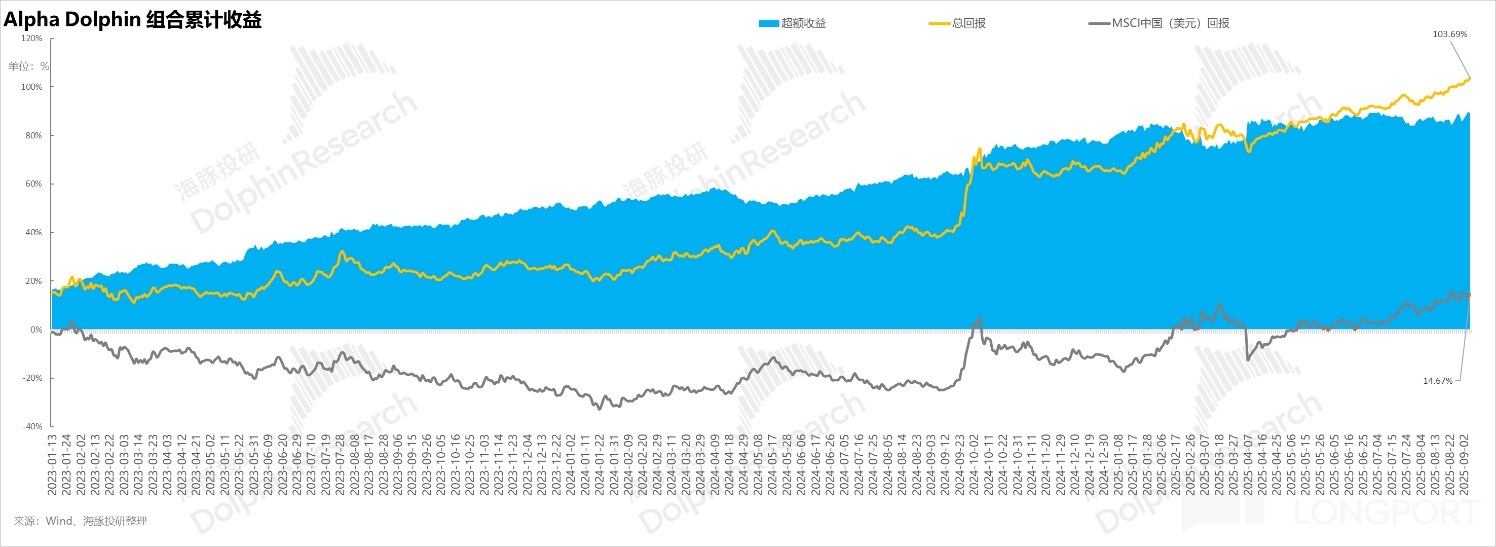
Last week, Dolphin Research's virtual portfolio Alpha Dolphin did not adjust its positions. The portfolio rose by 2.2% during the week, outperforming the S&P 500 (+1.6%) and the CSI 300 (+1.4%), but underperforming the MSCI China Index (+4.2%) and the Hang Seng Tech Index (+5.3%).
Since the portfolio started testing (March 25, 2022) until last weekend, the portfolio's absolute return is 109%, with an excess return of 89% compared to the MSCI China Index. From the perspective of asset net value, Dolphin Research's initial virtual asset of $100 million has exceeded $211 million as of last weekend.
5. Individual Stock Gains and Losses Contribution
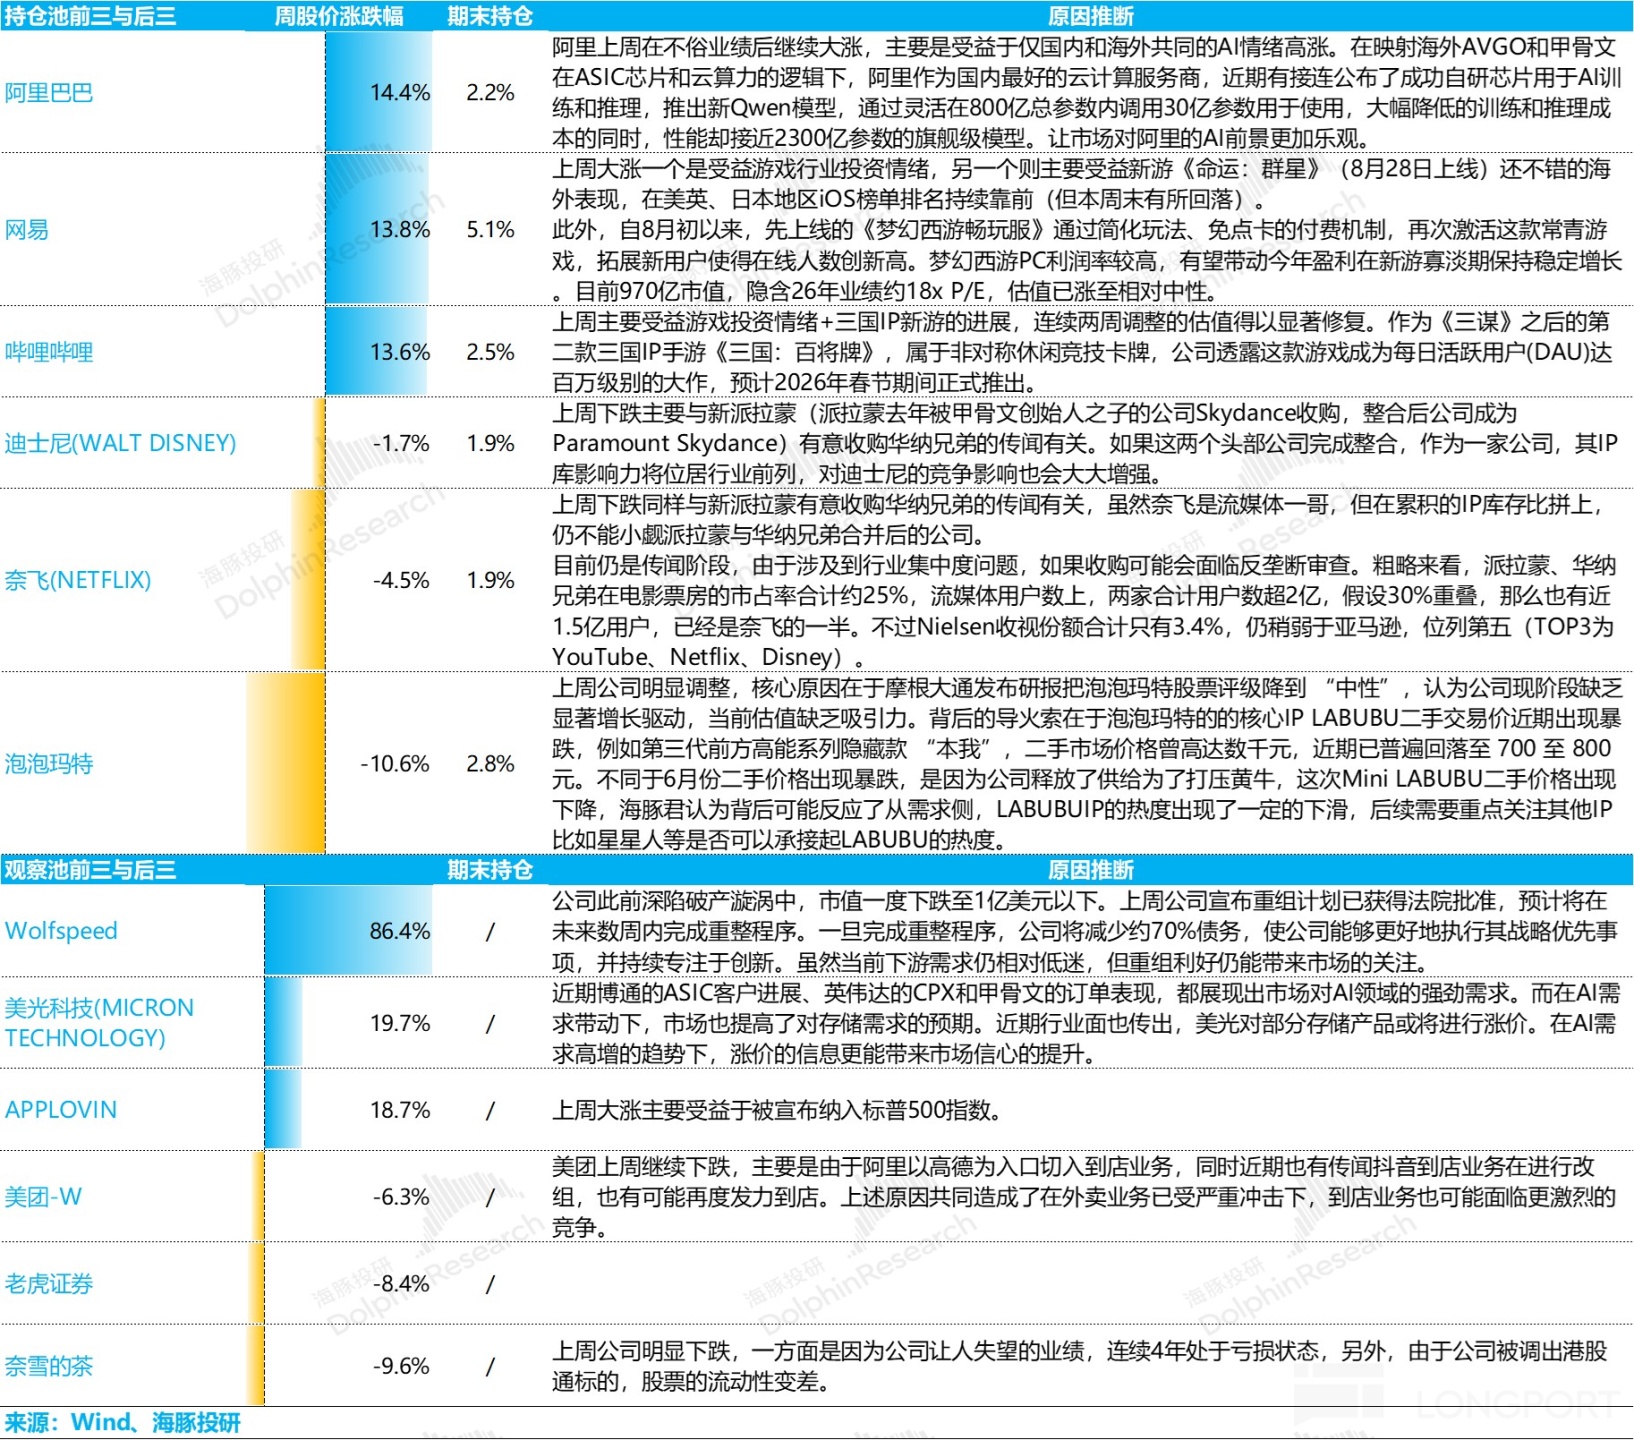
Last week, the main contributors to the gains of Dolphin Research's virtual portfolio Alpha Dolphin were Chinese concept stocks such as NetEase, Alibaba, and Bilibili, which achieved excess returns against the backdrop of the Fed's rate cut. However, due to the high allocation of gold and bonds, the returns were slightly lower compared to high-elasticity indices like the Hang Seng Tech Index.
The main individual stock price changes are explained as follows:
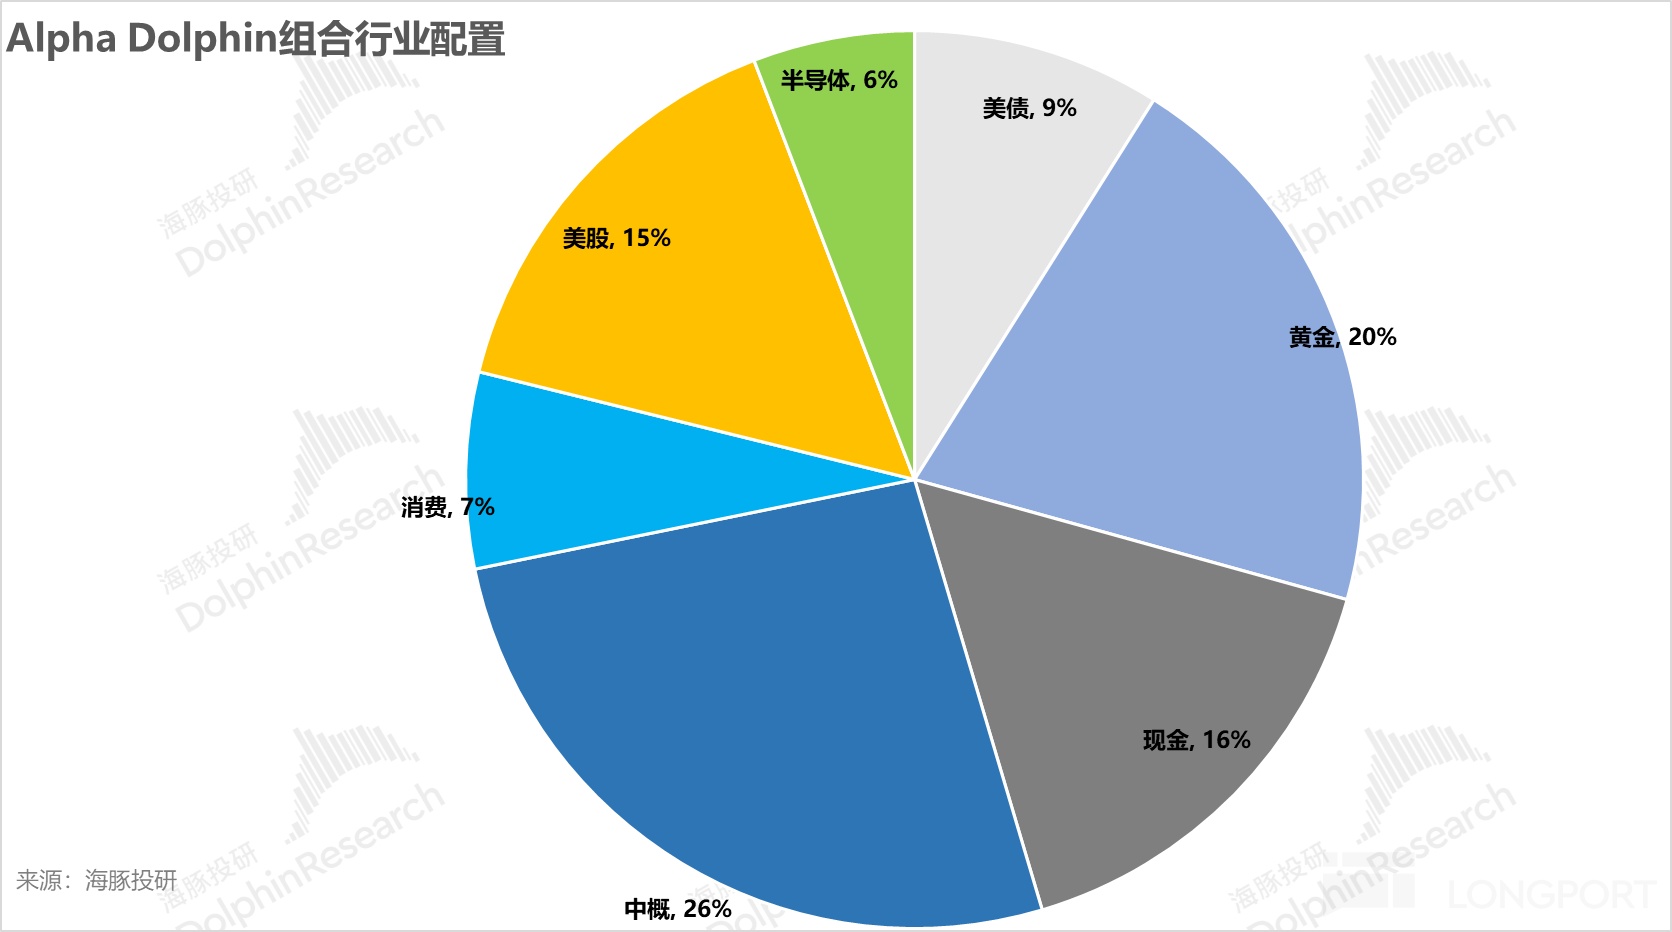
6. Asset Portfolio Distribution
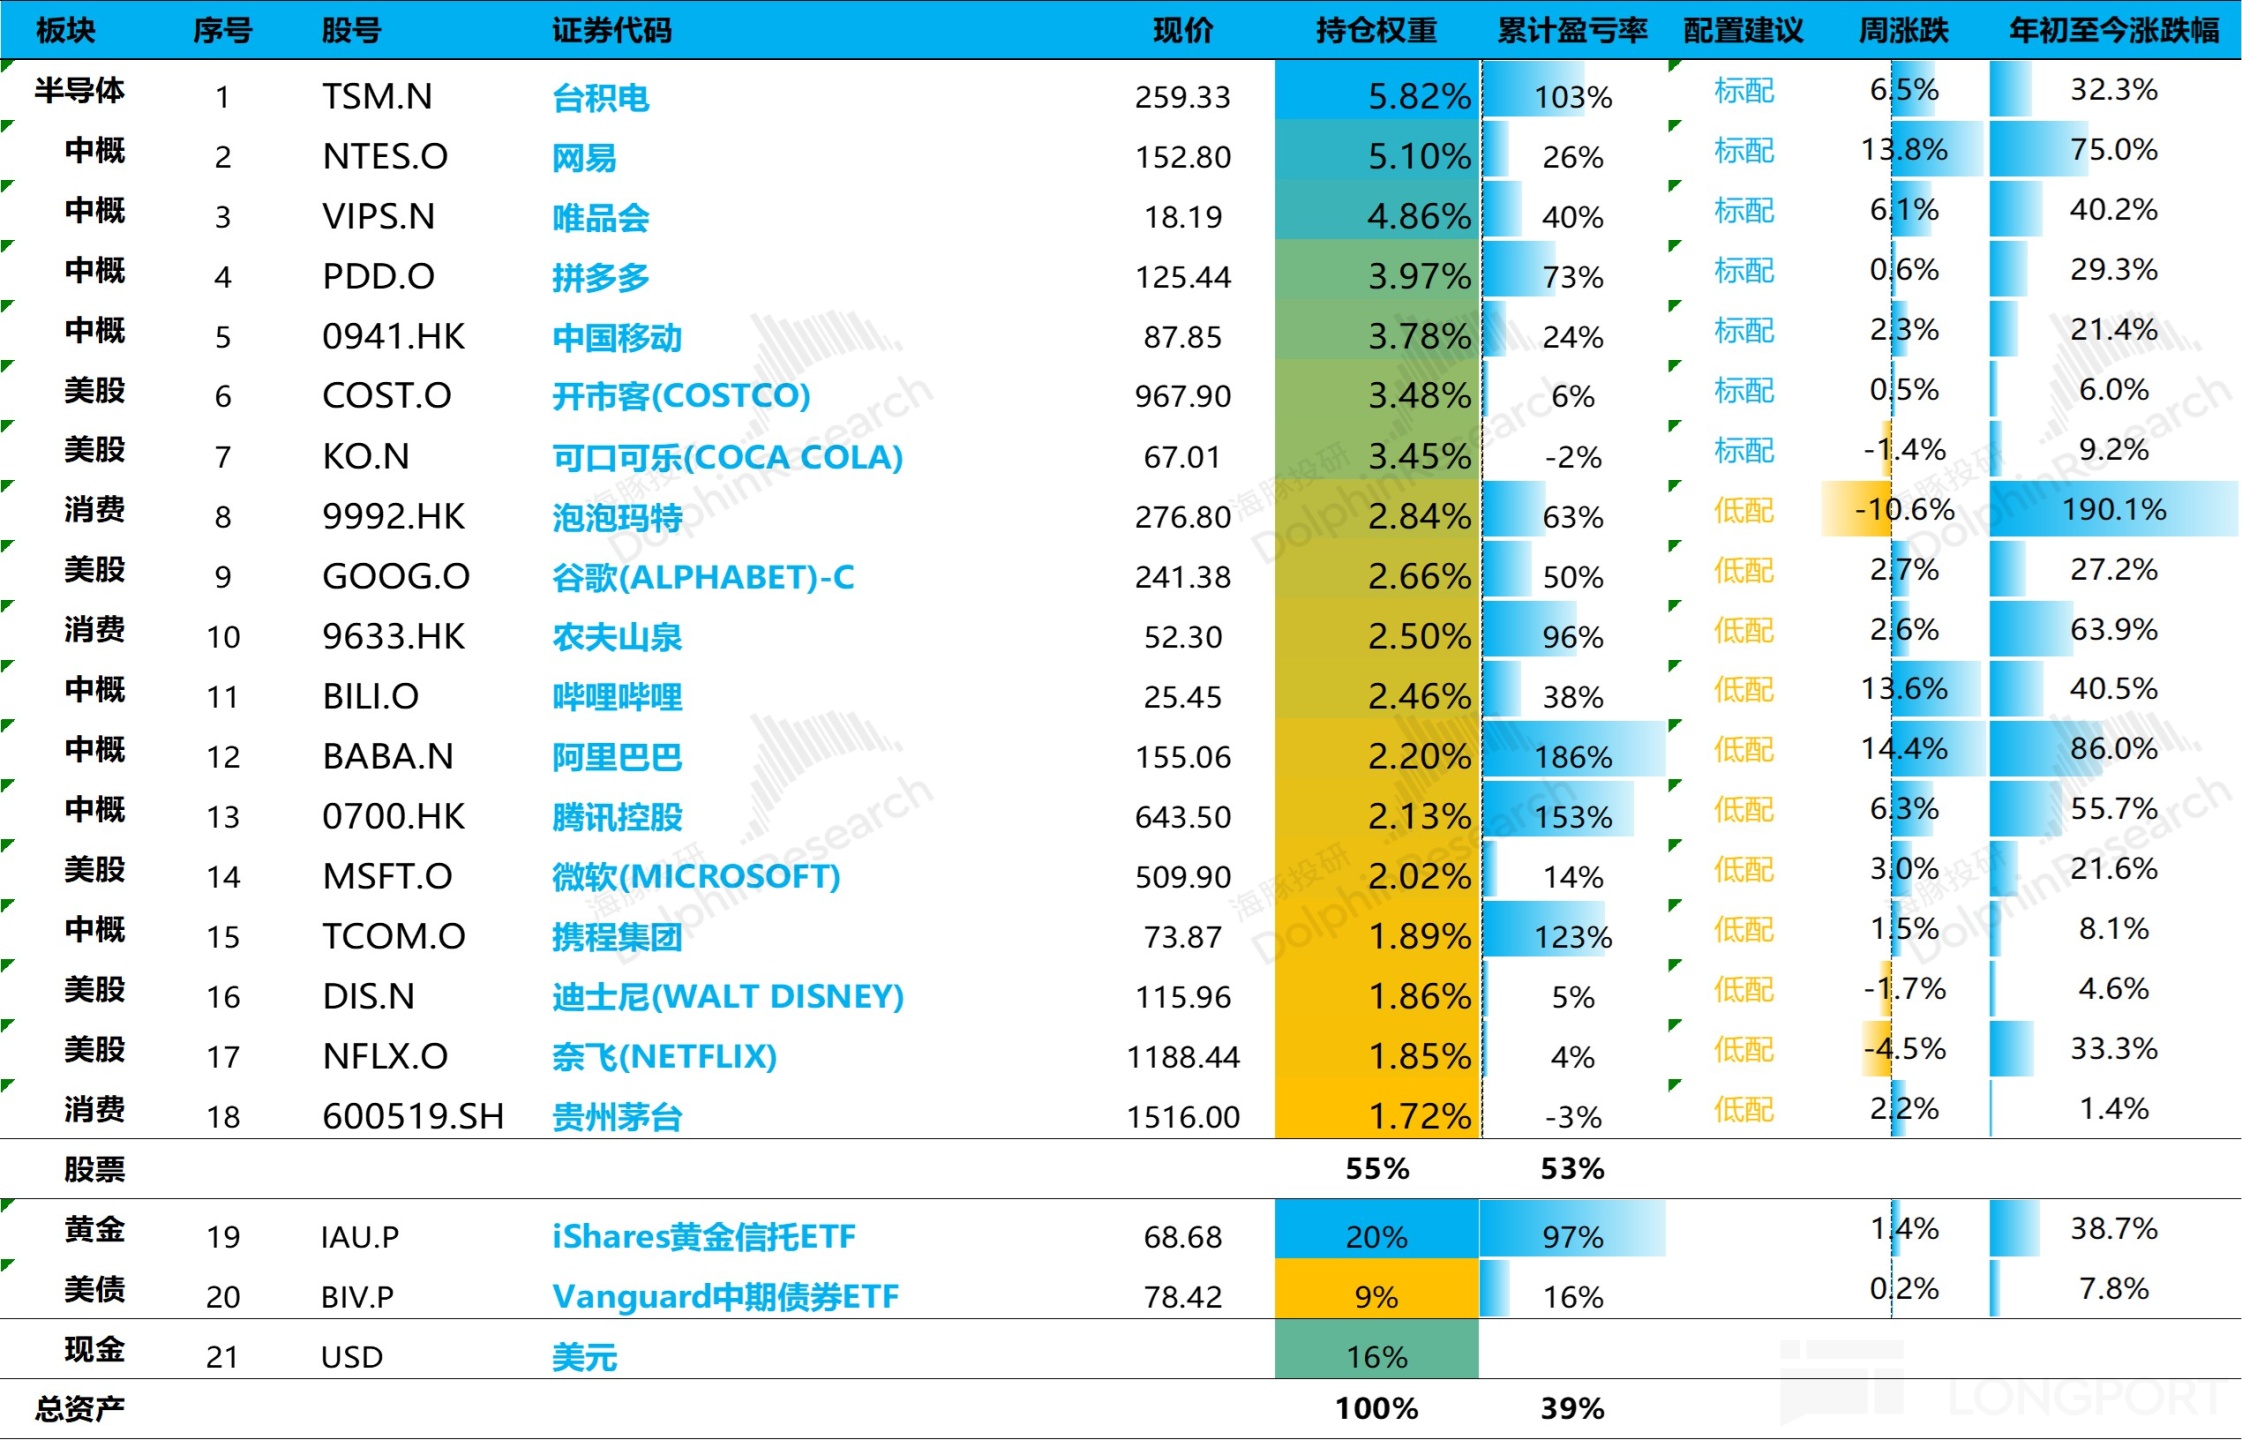
The Alpha Dolphin virtual portfolio holds a total of 18 stocks and equity ETFs, with 7 standard allocations and the rest underweight. Non-equity assets are mainly distributed in gold, U.S. Treasury bonds, and U.S. cash, with the current ratio of equity assets to defensive assets such as gold/U.S. Treasury bonds/cash being approximately 55:45.
As of last weekend, the asset allocation and equity asset holding weights of the Alpha Dolphin portfolio are as follows:
<End of Text>
Risk Disclosure and Statement of This Article:Dolphin Research Disclaimer and General Disclosure
For recent articles on Dolphin Research's portfolio weekly report, please refer to:
"A Fierce Toss, Trump Ultimately Can't Escape 'Inflation to Pay Off Debt'?"
"This is the Most Down-to-Earth, Dolphin Investment Portfolio Starts Running"
The copyright of this article belongs to the original author/organization.
The views expressed herein are solely those of the author and do not reflect the stance of the platform. The content is intended for investment reference purposes only and shall not be considered as investment advice. Please contact us if you have any questions or suggestions regarding the content services provided by the platform.
