
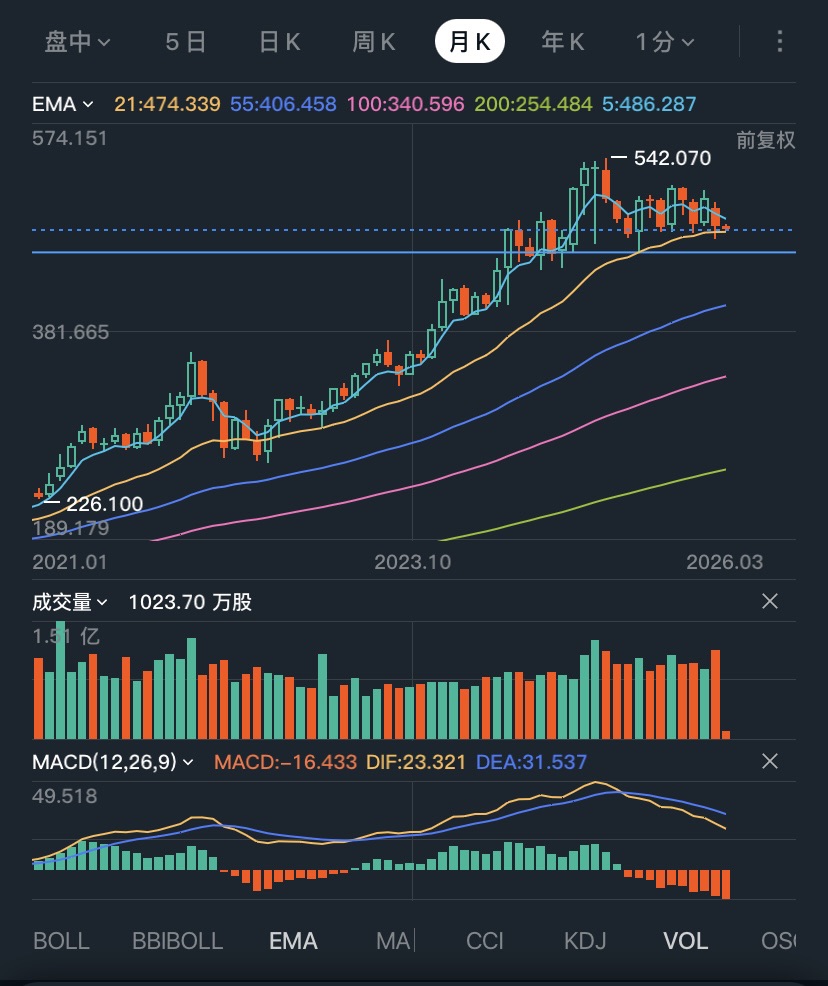
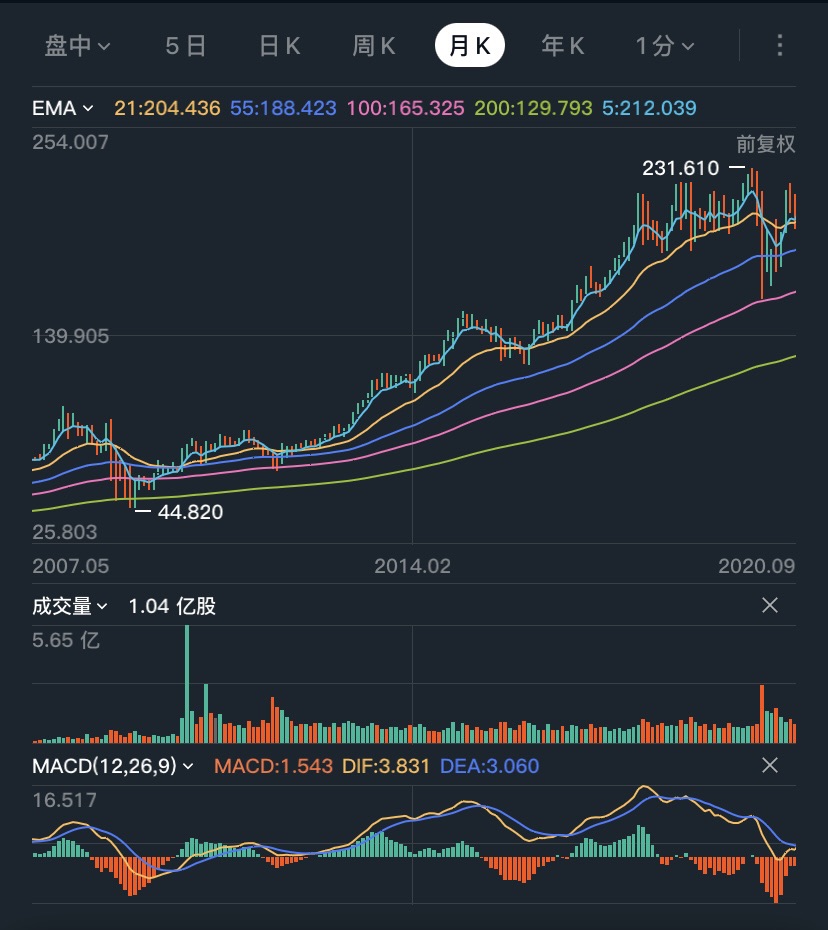
$Berkshire Hathaway B(BRK.B.US) Historical data backtesting of the major trend on the monthly chart shows that it must at least break below the EMA21 by a certain distance and sustain for more than two months. Pay attention to the position of that pin bar in August 2025 (455).
This is still a conservative pullback. If it's an extreme bear market crash scenario (e.g., 2008/2020), it would need to go further down to touch the monthly EMA55/100 (black swan, relatively low probability).
The more likely scenario, based on historical data, is to break below the monthly EMA21 again, consolidate for a while, and then rebound and reverse (a second retest for confirmation).
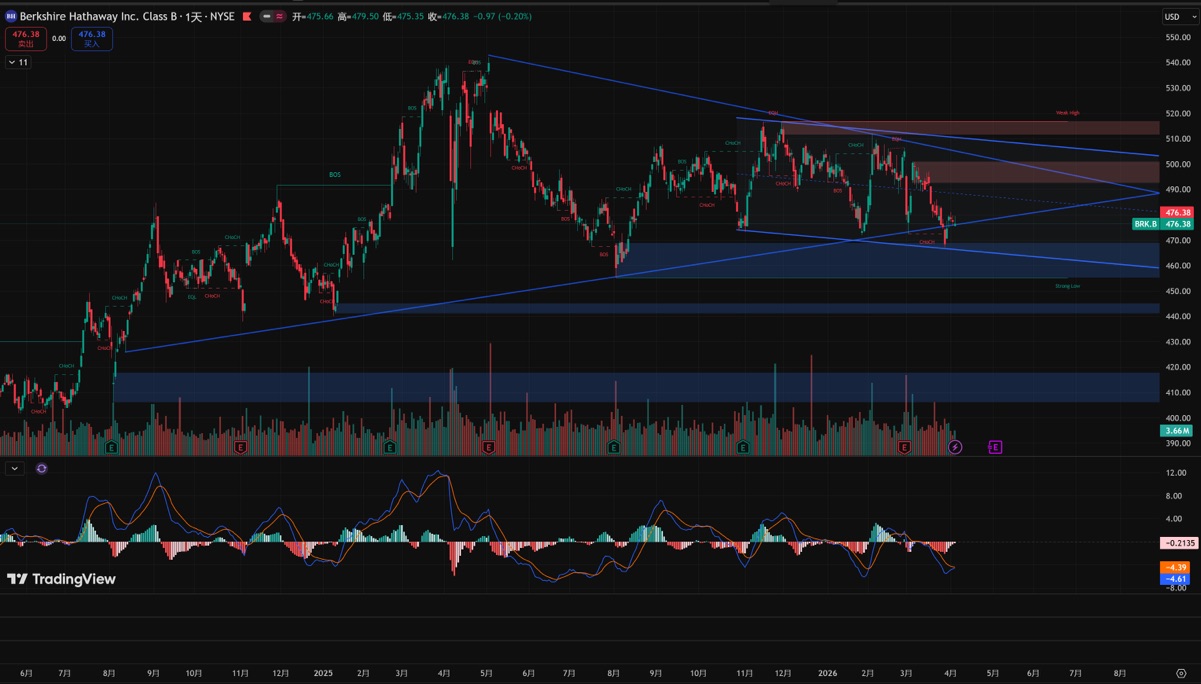
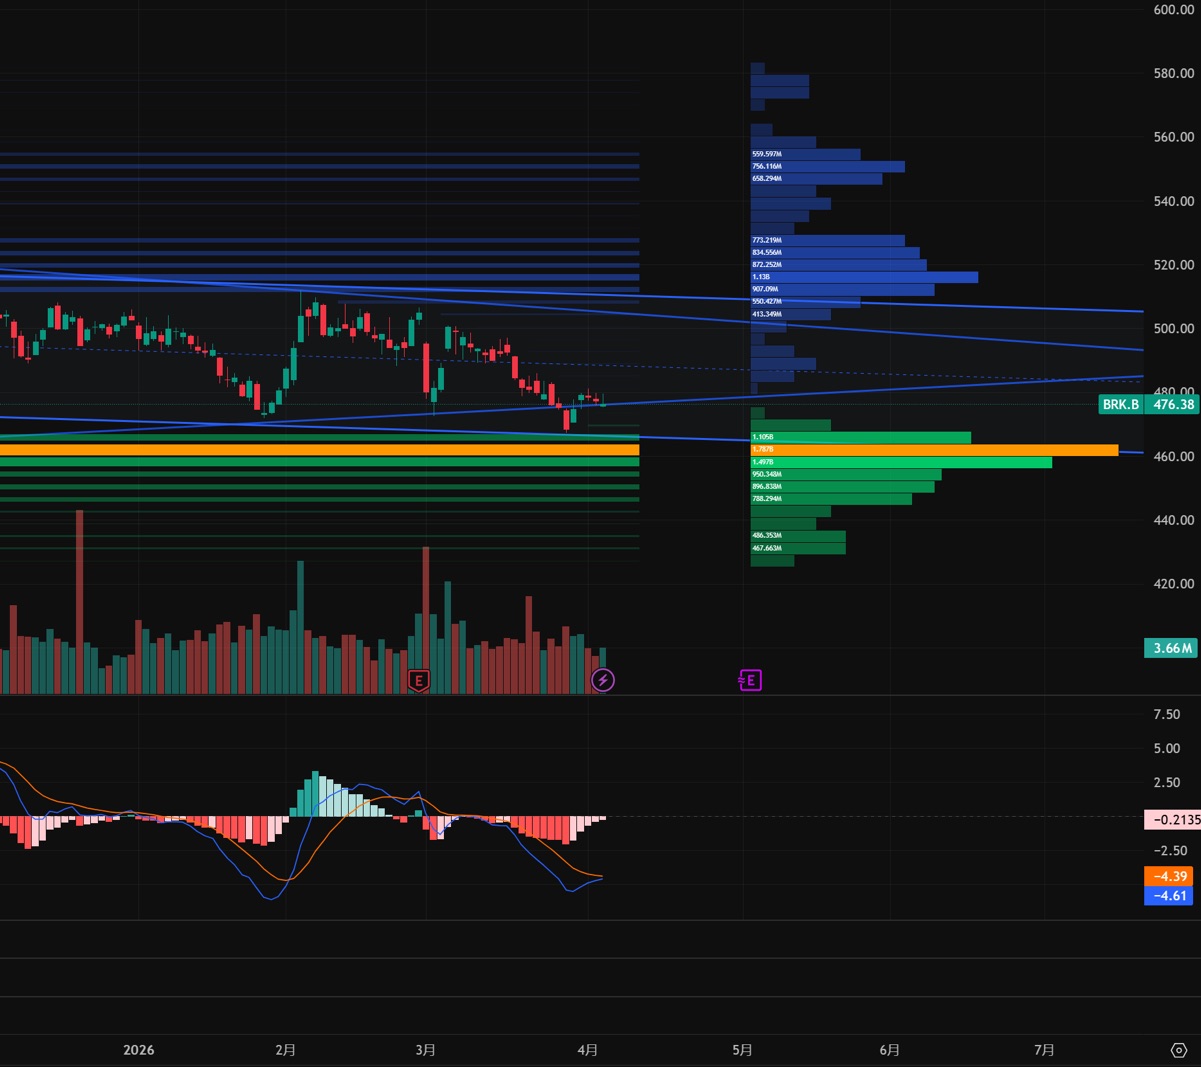
On the daily chart, order flow shows strong support levels between 456 and 466, with a large buy wall between 459 and 463.
The copyright of this article belongs to the original author/organization.
The views expressed herein are solely those of the author and do not reflect the stance of the platform. The content is intended for investment reference purposes only and shall not be considered as investment advice. Please contact us if you have any questions or suggestions regarding the content services provided by the platform.
