


AI Compute: From Feast to Leftovers?
In Dolphin Research's earlier piece '‘AI Drag’ at Amazon: A Comeback in the Making?', we examined AWS's AI build-out from multiple angles. From in-house silicon to its Anthropic partnership and model capabilities, Amazon's overall AI competency has improved meaningfully. The gap with top-tier peer Google has narrowed visibly.
Dolphin Research is intrigued by two points. First, hyperscalers' AI margins seem better than expected. Second, hyperscalers are highly reliant on model partners, with cloud revenue growth tied closely to AI model consumption.
In this note, we take a more granular, quantitative look at the issues. We aim to clarify the drivers and bounds of margin uplift, and how model-side compute demand translates into hyperscalers' revenue growth.
1) What underpins the margin expansion at cloud vendors, and how much headroom remains? 2) How much does model providers' compute demand lift cloud revenue, and what risks arise from over-reliance on model partners?
3) What does this imply for sector positioning across the AI value chain? Here is our detailed analysis:
I. Mapping AI cloud GPM shifts and the drivers
As discussed previously, one reason AI cloud margins are not as weak as feared is mix shift: higher-GPM MaaS/TaaS is partly displacing low-GPM 'bare-metal' IaaS. From first principles, the decisive factor is the hyperscalers' bargaining power across the AI stack.
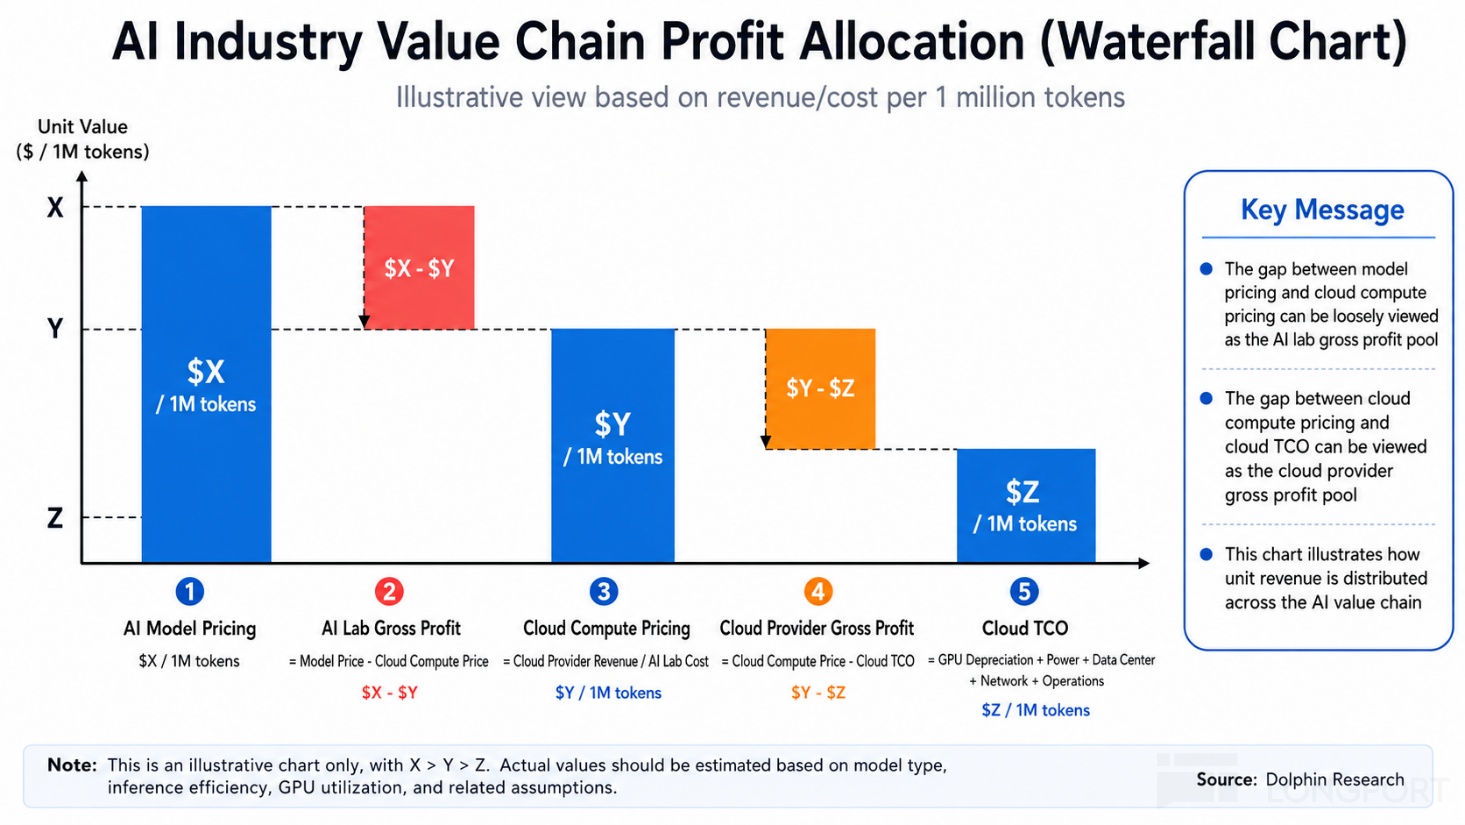
Quantitatively, pricing hinges on three elements: end-user prices for LLM usage, compute prices charged to AI Labs, and the hyperscalers' cost to supply compute (split into relatively fixed ops costs like power and variable hardware costs). We therefore assess these three through a unit-token economics lens, tracking trends and their impact on cloud and ecosystem margins.
1.1 How are prices moving for models, cloud, and chips?
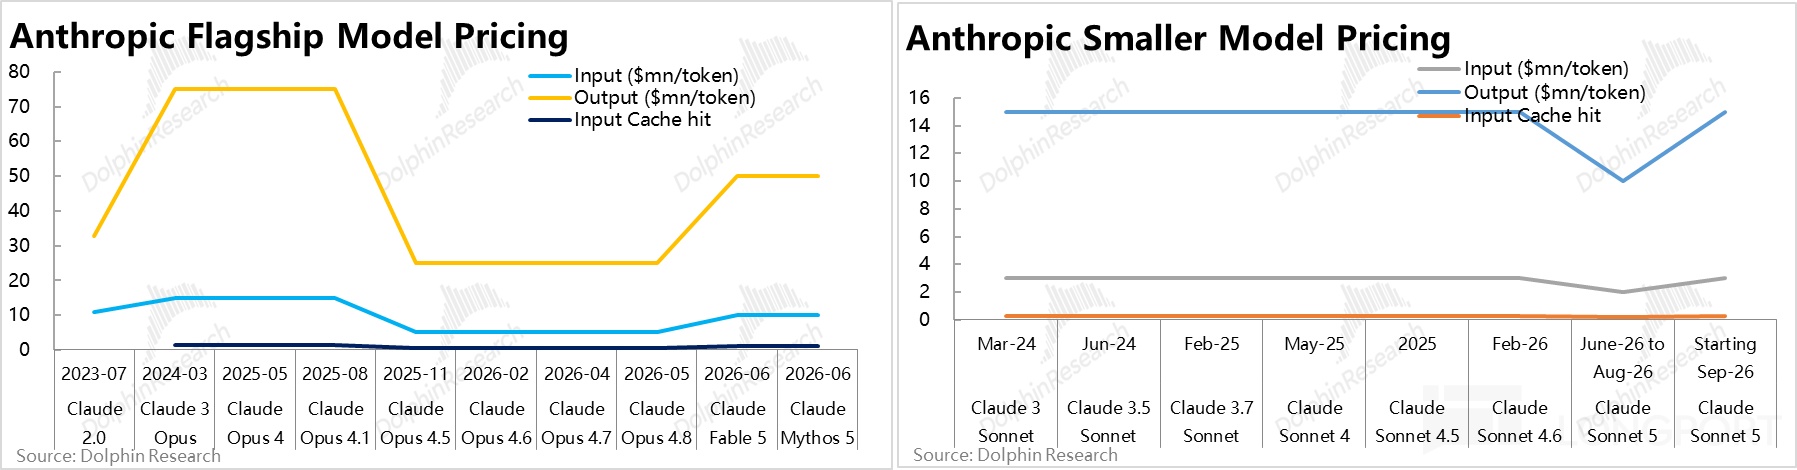
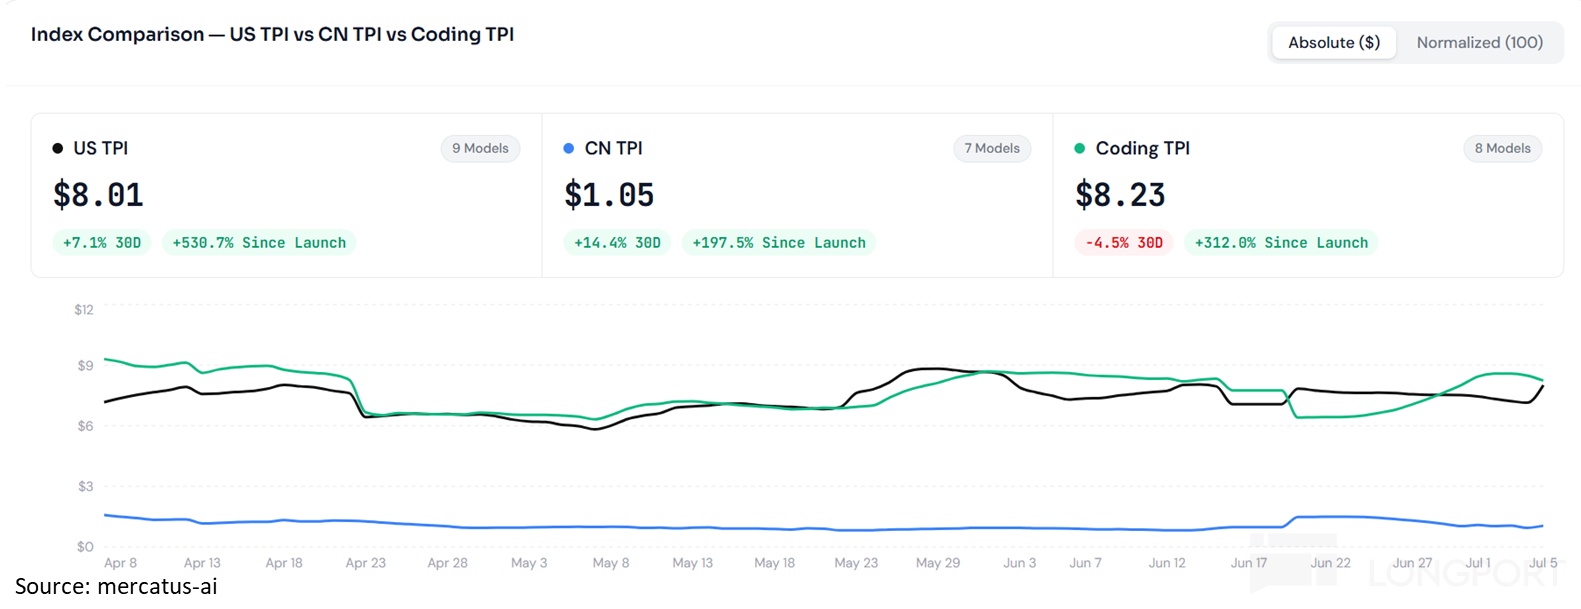
a) Model pricing: neither inflation nor deflation. Looking at usage-based pricing (excluding subs), both Anthropic's list prices and third-party token price indices (mixing input/output/cache-hit rates across model tiers) show that model prices have not trended up with capability gains. Instead, they have oscillated in a range or stayed flat.
b) Unit compute costs are clearly deflating. Unlike token prices, the unit cost to generate a token has shown a marked deflation trend over time. Here we use SemiAnalysis's TCO framework, which includes capex for buildout and opex for operations.
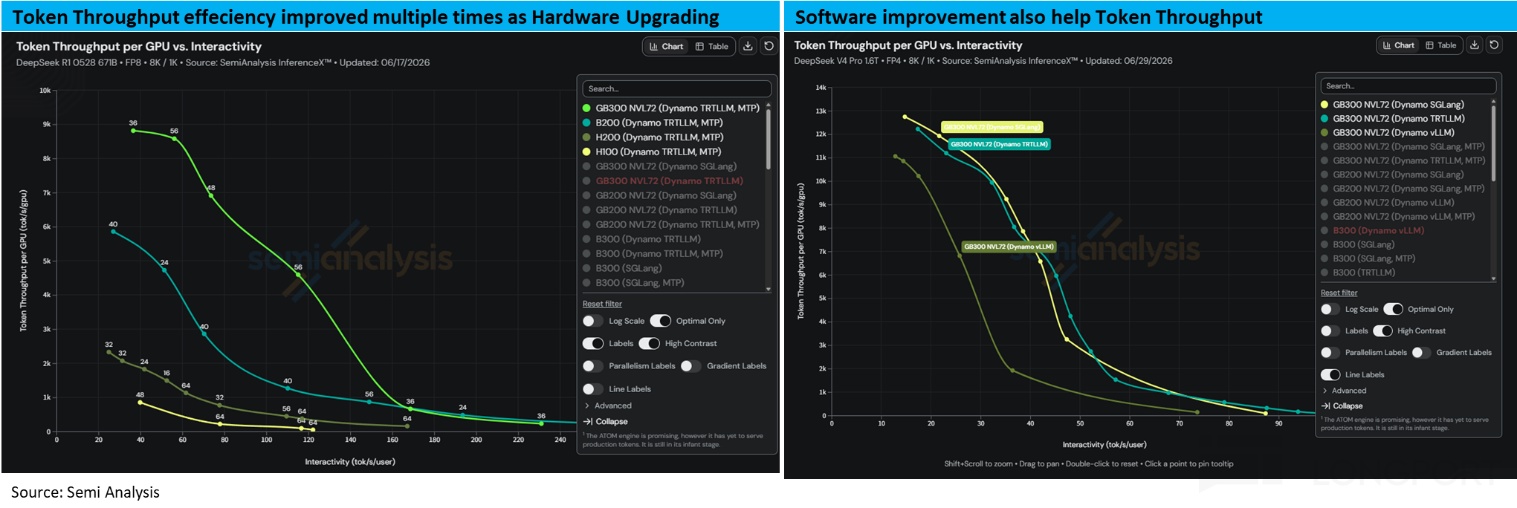
On Qwen 3.5 as a test case, unit token-gen costs fall sharply with chip node progression. For example, GB200 NVL72's cost per mn tokens is roughly 1/3–1/4 that of H100/200. This is because chip prices have risen by far less than token throughput, with efficiency gains driven by both hardware and software.
On hardware, using DeepSeek R1 as an example under the same orchestration, GB300's tokens/sec are about 4–10x H200. On software/engineering, with DeepSeek V4 on the same GB300 hardware, orchestration alone can create a 2–4x spread in throughput.
With up to 10x efficiency deltas, a single GB300, while pricier than H200, is not more than ~2x. Performance leaps outpace price increases, so the net effect is deflationary. That dynamic dominates unit economics.
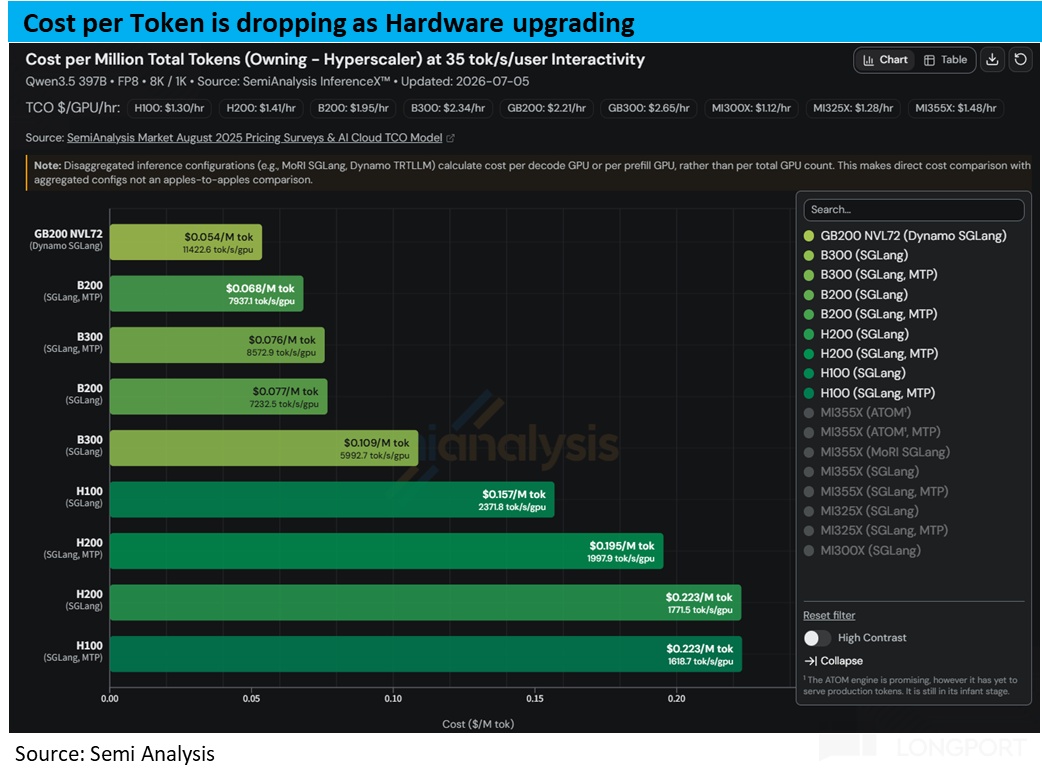
c) A simple gauge: at a blended price of $1 per mn tokens for Qwen 3.5, and considering only the chip-driven drop in unit token-gen cost from ~$0.20 (H200) to ~$0.05 (GB300), GPM per token can expand by ~15ppts. In short, the AI chip industry still exhibits a 'tech-deflation' effect: each node delivers much higher performance for relatively modest price increases.
Put differently, a good portion of each generation's performance gains is passed downstream. Yet LLM pricing has not passed those gains to end users, with model providers retaining the benefit as margin.
1.2 Have hyperscalers raised prices?
As noted, the spread between end-user pricing and hardware run-cost is shared between cloud vendors and model companies. The split is largely determined by cloud compute rental rates: if cloud prices are flat, the 'extra margin' accrues mostly to AI Labs; if cloud prices trend higher, hyperscalers capture a share of that upside. What do we see in practice?
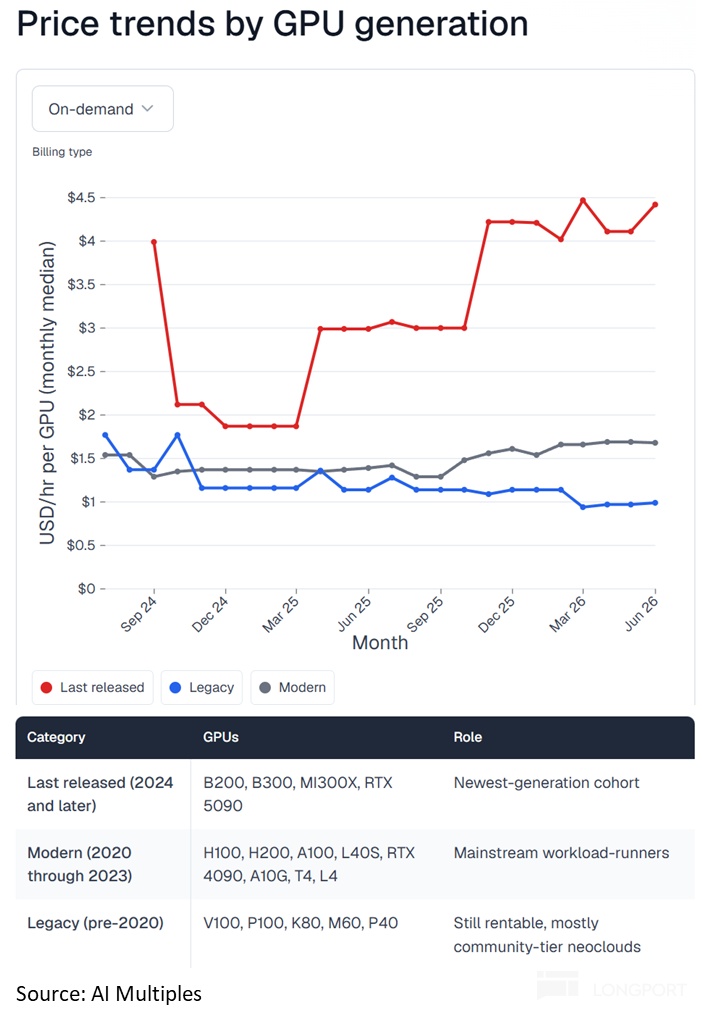
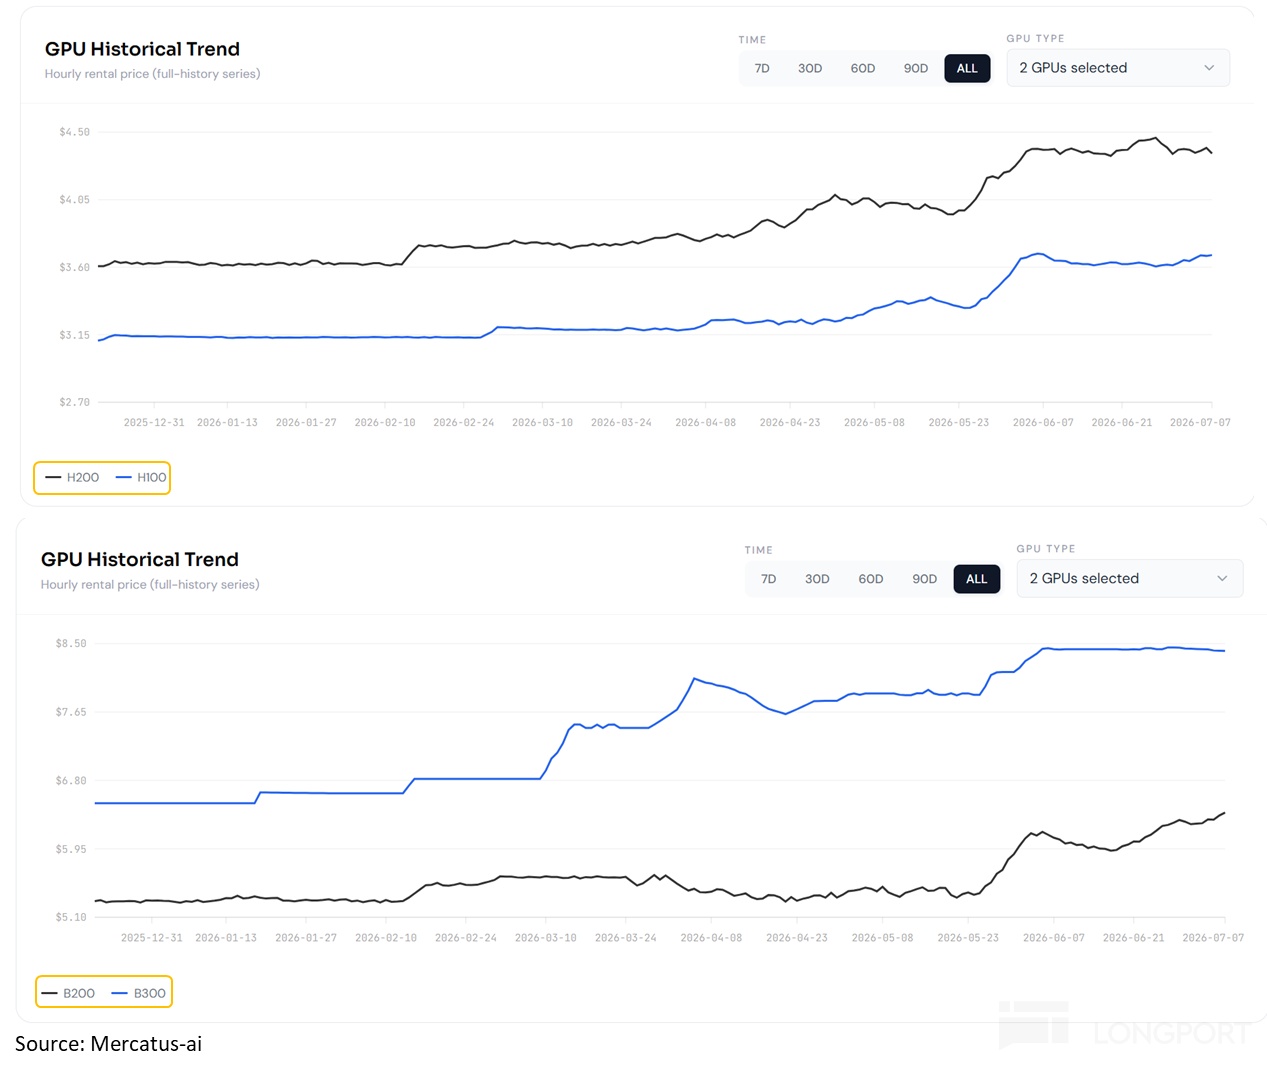
Based on multiple sources for on-demand rates, a common pattern emerges: cloud GPU pricing has been on a clear upswing since late '25. With supply-demand imbalances acute, hyperscalers' pricing power has improved, so even 'bare-metal' IaaS should see GPM expansion alongside mix benefits. Specifically:
a) Newest chips have risen the most. For the latest GPUs (e.g., B200 or newer), on-demand rates have climbed about 25%–50% since late '25, depending on the source. This reflects tightness at the bleeding edge.
b) Prior-gen mainstream chips are also pricier. For the current mainstream GPUs in market (H200 or earlier), on-demand rates are up roughly 15%–20% since late '25. These chips logically should have trended down with time and tech.
Yet even parts launched 3–5 years ago have seen counter-trend price hikes. This both confirms severe supply scarcity (customers pay up for older, lagging parts) and signals that hyperscalers' pricing power and margins are improving. Only GPUs older and weaker than A100 (pre-2020) show a phase-out pattern.
Average rates for those legacy parts have fallen by ~1/3 since late '24, but they are not zeroed out and still contribute revenue at lower prices. A key takeaway is that older chips do not become 'stranded assets' with each new node; they continue to throw off cash flow.
II. How much have AI cloud margins improved?
2.1 Joint benefits from software and hardware gains
We have qualitatively argued that both model providers and clouds are seeing AI compute margin improvement (not to be confused with AI compute margins surpassing traditional cloud). Next we quantify how much margins may have changed for each.
To simplify, we estimate 'inference GPM' only, considering inference revenue and direct compute cost, excluding training/R&D. We use Qwen 3.5 to keep model fixed; absolute levels may not reflect reality, but relative changes and trends remain informative.
We run two comparisons via controlled variables. First, a longitudinal view holding hardware constant, measuring the effects of software/engineering advances that lift tokens/sec and the rise in cloud rental rates over time. Second, a cross-sectional view on current tech/pricing, comparing margins across chips. All figures are on a per-GPU basis.
Headline results:
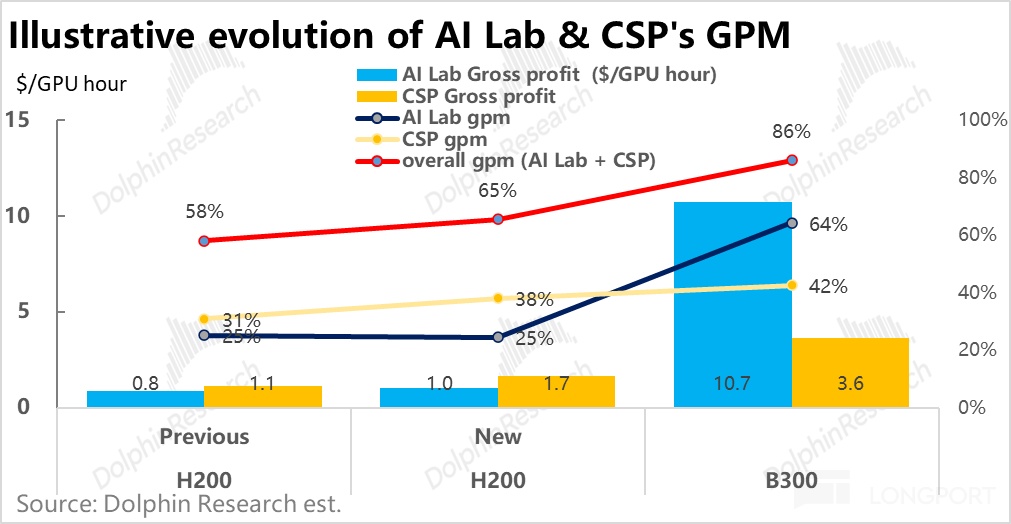
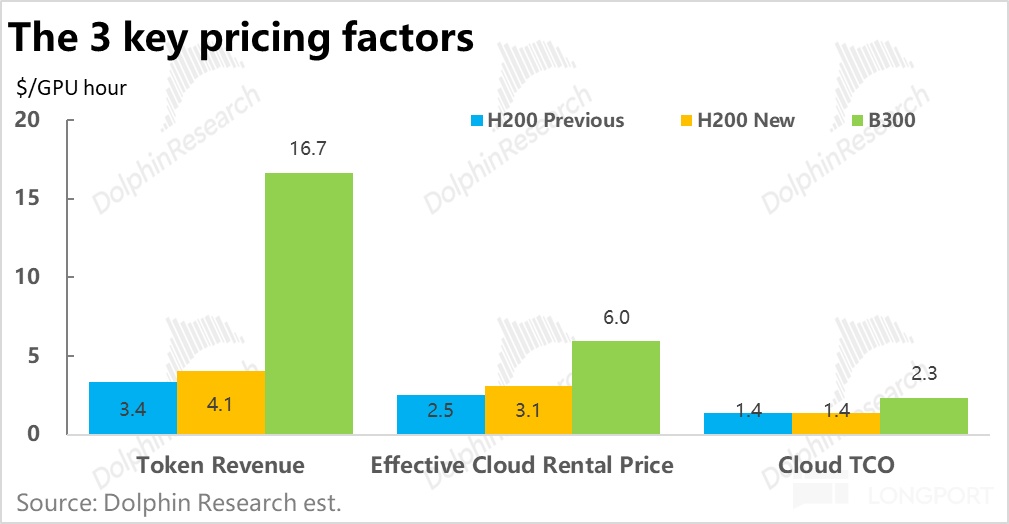
a) Holding H200 constant, assume ~20%+ tokens/sec gain from software over time and ~20% rental rate increase post-Sep '25. Under these, AI Lab inference GP per GPU-hour rises from ~$1.2 to ~$1.4, with GPM roughly stable as unit revenue also increases. Cloud GP per GPU-hour rises from ~$0.8 to ~$1.7, with GPM improving from 31% to 38%. Note that long-term contracts between AI Labs and clouds may constrain realized price step-ups.
b) On latest software and pricing but switching hardware from H200 to B300, B300's output explodes to ~8x H200 while rental is <2x. AI Lab GP per GPU-hour jumps from ~$1.4 to ~<$11.6>, with GPM rising from 35% to 69%. Cloud GP per GPU-hour increases from ~$1.7 to ~$3.6, with GPM from 38% to 42%.
c) Combining the two, comparing GB300 vs. H200 with older software, joint soft+hard progress boosts unit GP from sub-$2 to >$14. Even if the lion's share accrues to model providers, hyperscalers still 'drink the soup' with a >10ppt GPM uplift.
Note these estimates exclude recent price inflation in non-GPU hardware like memory. Those are mostly price increases without performance uplift and would compress cloud margins.
2.2 Can Trainium drive even higher margins?
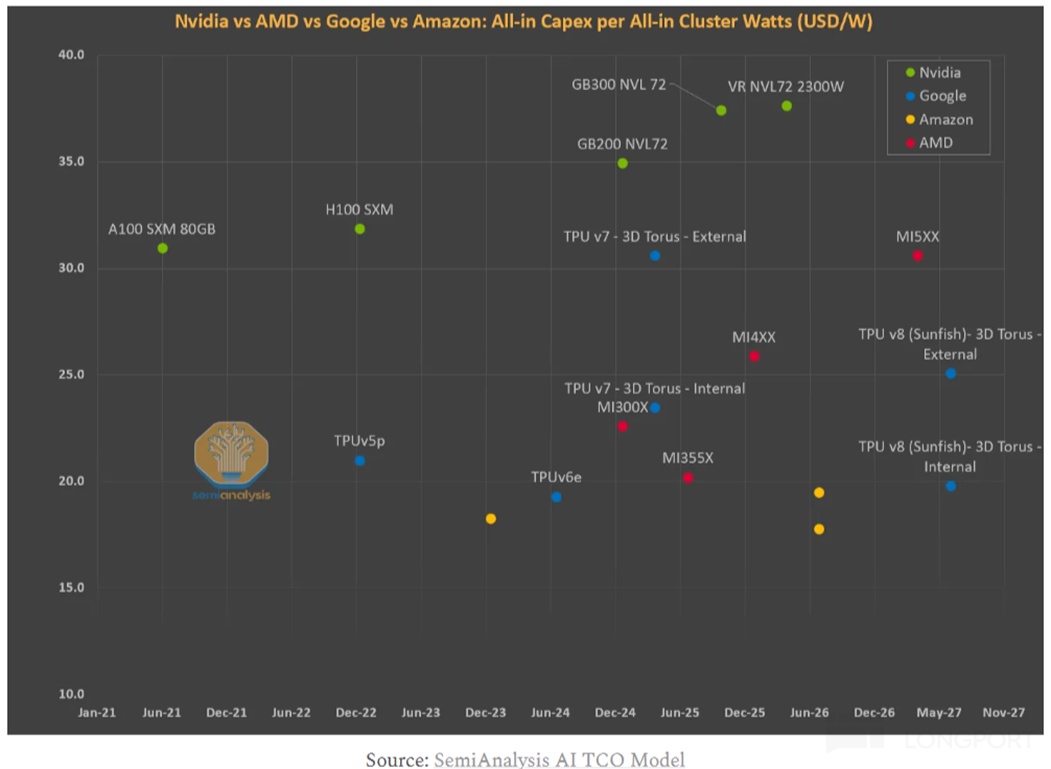
The above uplifts were based on NVIDIA parts, yet a core edge for hyperscalers is in-house silicon. With vertically integrated HW+SW and targeted optimization, proprietary chips often deliver better margins. So, how much could Trainium 3 improve AWS's AI compute margins?
We need two inputs: tokens/sec on Trainium 3 and its TCO. a) Token throughput: While we lack public benchmarks, paper specs show FP8 compute of 2.5 PFLOPs for Trn3, ~25% above H200 and ~50% of B300. This implies ~2,600–4,300 tokens/sec; we assume the lower end and set ~3,000 tokens/sec on Qwen 3.5.
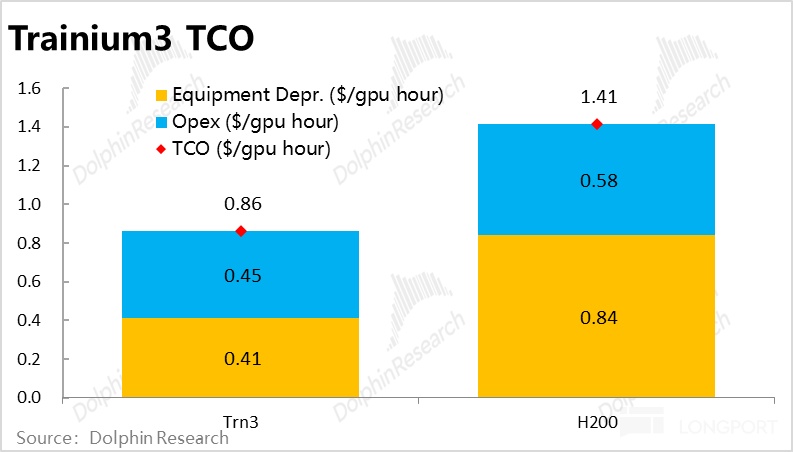
b) TCO: Total run cost comprises depreciation on chips and supporting gear, plus relatively fixed costs for DC shell, power/cooling, and ops. Per SemiAnalysis, Trn3 all-in capex is $17–$19 per W, about half GB300's capex per W. With a 5-yr life, depreciation is ~$0.41 per GPU-hour.
For quasi-fixed costs like facility depreciation and electricity, our 10-chip survey shows $0.44–$0.51 per kWh equivalents. With in-house optimization, we assume Trn3 near the low end, at ~$0.45 per GPU-hour. Summing both, Trn3 TCO is ~$0.86 per GPU-hour, nearly 40% below H200's ~$1.41.
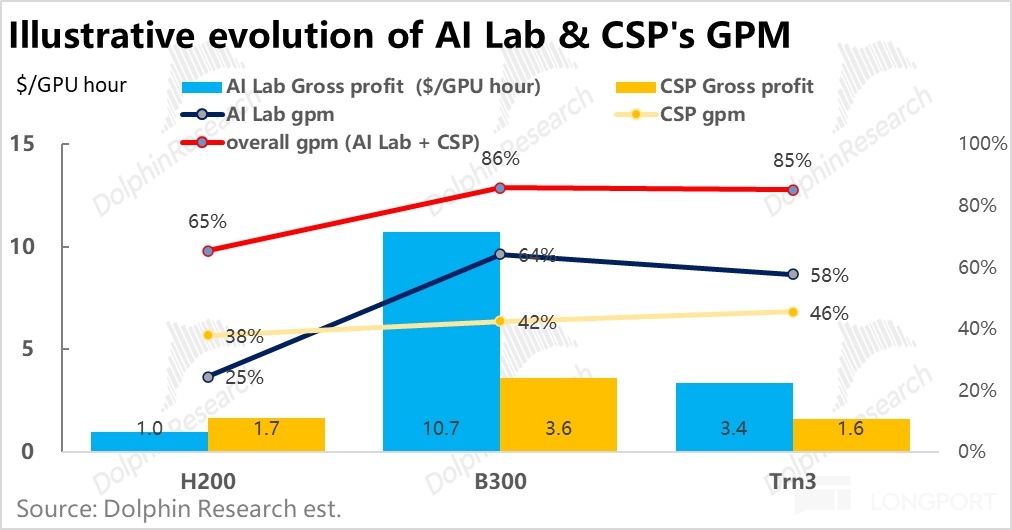
c) Trainium 3 margins approach B300. With ~30%–40% higher effective capability than H200 and ~40% lower TCO, Trn3 yields an ~85% blended GPM (shared between the cloud and model provider), approaching that of top-tier B300. For small-to-mid models in inference, Trn3 is near an economic substitute for B300.
Thus, if AWS prices Trn3 compute at ~70% of H200 (noting Trn3 outperforms H200), the cloud/model split matches the B300 case. If priced at 80% of H200, cloud GPM rises to ~46% vs. ~42% in the B300 scenario. In sum, with much higher tokens/sec, stable unit token pricing, and slightly higher cloud rates, AI GPM at hyperscalers can improve visibly.
And these estimates reflect low-margin bare-metal rentals. Layering in higher-margin MaaS/PaaS, blended AI margins for clouds should be higher still.
III. How much compute is coming on both supply and demand?
We have shown, qualitatively and quantitatively, that AI cloud margin expansion stems from rising bargaining power downstream. We now turn to a crucial factor for the industry: the magnitude of AI-driven cloud demand and whether it matches planned supply growth.
There are two lenses. At the sector level, supply-demand balance will shape competitive intensity and bargaining power across the chain. At the company level, we ask whether revenue expectations properly embed AI compute demand for each cloud, and whether planned capacity can support that revenue.
The core challenge is mapping demand (AI Labs' ARR) and supply (cloud capex) onto a common metric. ARR and capex are not directly comparable, obscuring whether capacity will remain tight or tip into surplus. We therefore convert both to compute scale (GW) and focus on outcomes through '28, acknowledging visibility beyond is limited.
3.1 Demand estimation
Incremental AI cloud demand largely comes from two leading AI Labs' training and inference needs, with smaller contributions from hyperscalers' self-use and other Big Tech. Thus, AI cloud demand approximates AI Lab demand.
Given non-linear tech progress, we cannot predict whether breakthroughs stall or surge. We therefore run a scenario: if model providers reach certain revenue levels, what is the implied cloud compute need? Our approach is as follows:
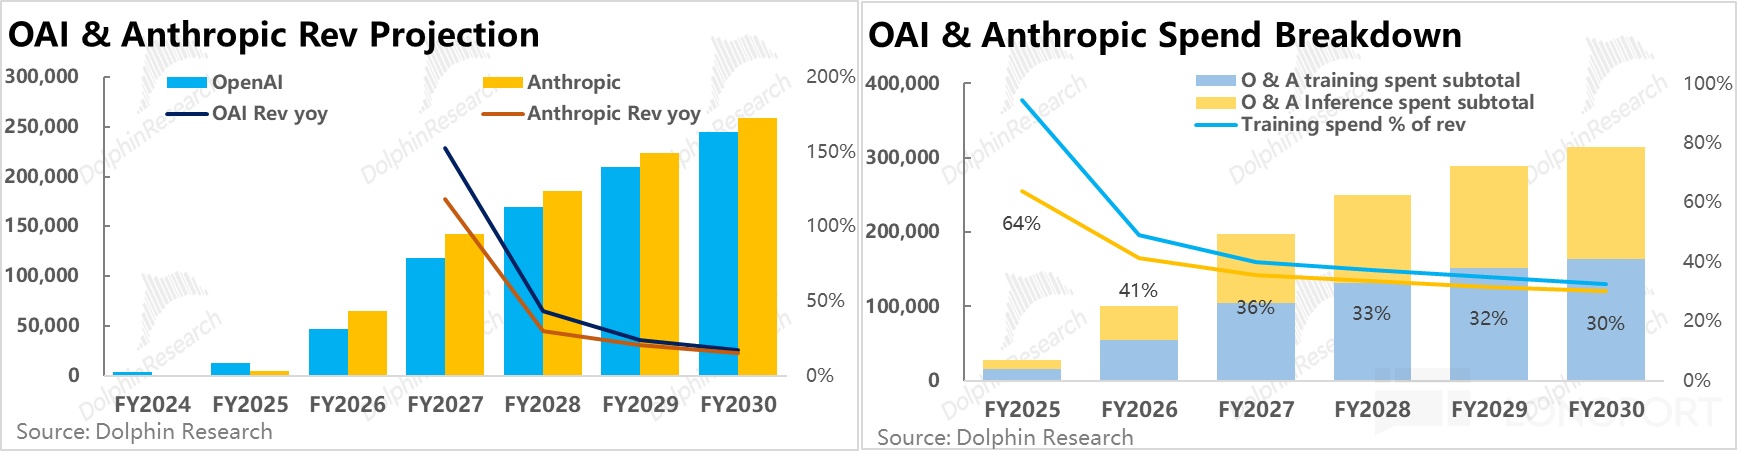
a) Revenue outlook for the two model unicorns: ~$250bn by 2030 each. OpenAI once floated ~$280bn by 2030; we haircut to ~$250bn for conservatism. A key assumption is that from 2028, revenue growth normalizes below 50% from prior triple digits, which matters for conclusions. We also assume OAI converges quickly to Anthropic from 2026 as model capability gaps narrow (e.g., GPT base and Claude Code vs. Codex).
b) Cloud compute spend splits into training and inference. On inference, we expect modest GPM expansion on improved chip efficiency, offset by eventual pricing pressure as token rates cannot stay flat indefinitely. Thus, we model inference GPM rising only from ~65% to ~70% by 2028.
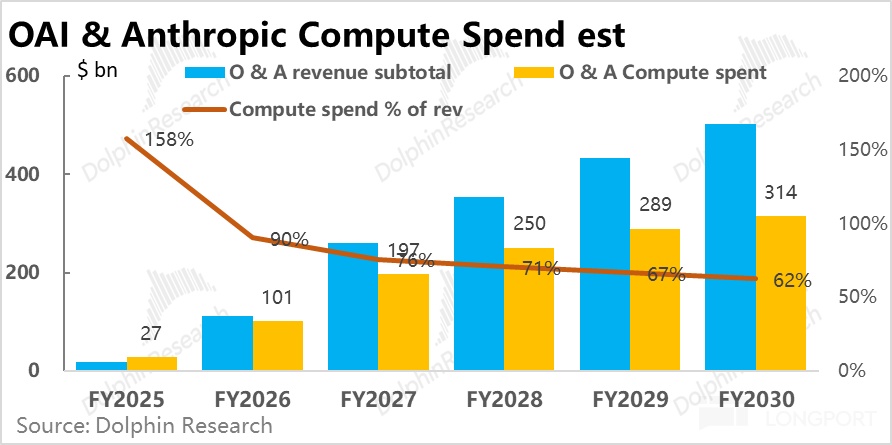
Training spend may not scale with revenue and depends on model progress. Conservatively, we assume training spend nearly doubles YoY in 2027, then drops below 30% growth from 2028. On these, combined cloud spend by the two leaders reaches ~$250bn by 2028, ~71% of revenue.
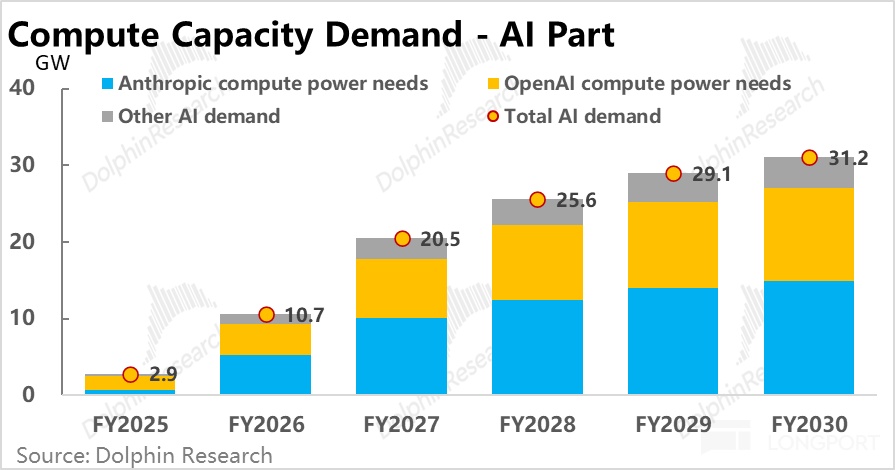
c) Total AI compute demand reaches ~26GW by 2028. Using conversion logic across training vs. inference and GPU/ASIC/CPU mixes (omitted here for brevity), and assuming other AI Labs' demand is ~15% of the two leaders', we estimate ~25.6GW by 2028, up nearly 23GW vs. 2025.
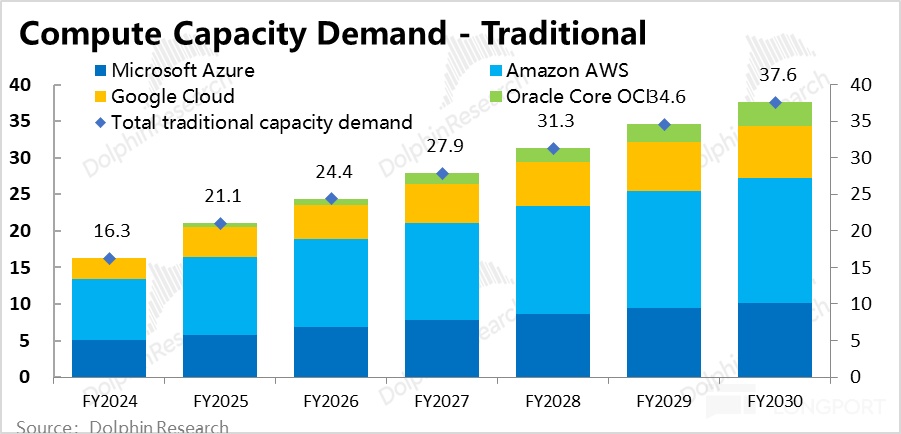
d) Traditional cloud demand
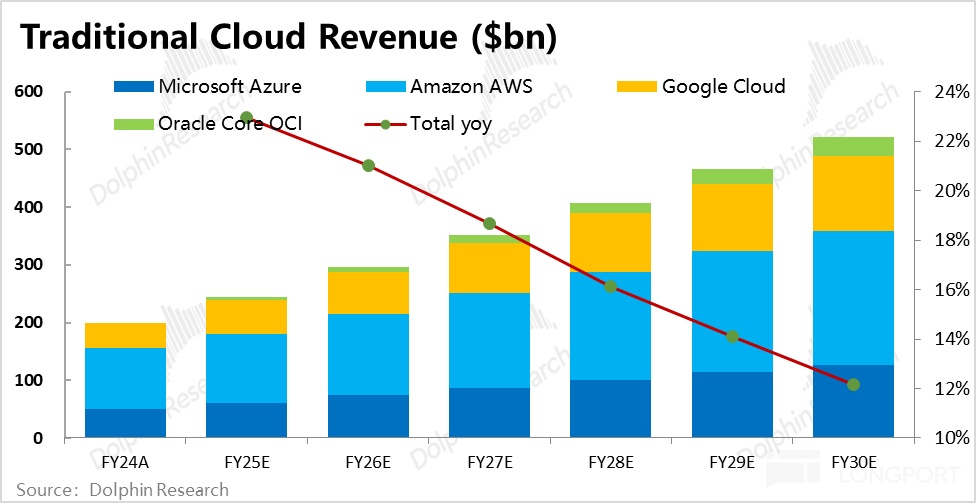
While growth has cooled, traditional workloads still represent the majority of base. We therefore add incremental compute for legacy demand.
The method is straightforward: with ~100% of 2024 cloud revenue and capacity still serving traditional use, we use 2024 live capacity and revenue as a base. We then scale required compute in line with projected traditional cloud revenue growth.
Given management commentary that AI (esp. Agents) also drives traditional workloads, we assume traditional cloud rev. grows ~20% in 2026–27. Recognizing finite IT budgets and substitution between AI and legacy IT, we conservatively slow growth post-2028.
On this, we estimate ~31GW of compute for traditional cloud by 2028, up ~10GW vs. 2025.
3.2 Supply-demand: surplus from 2028?
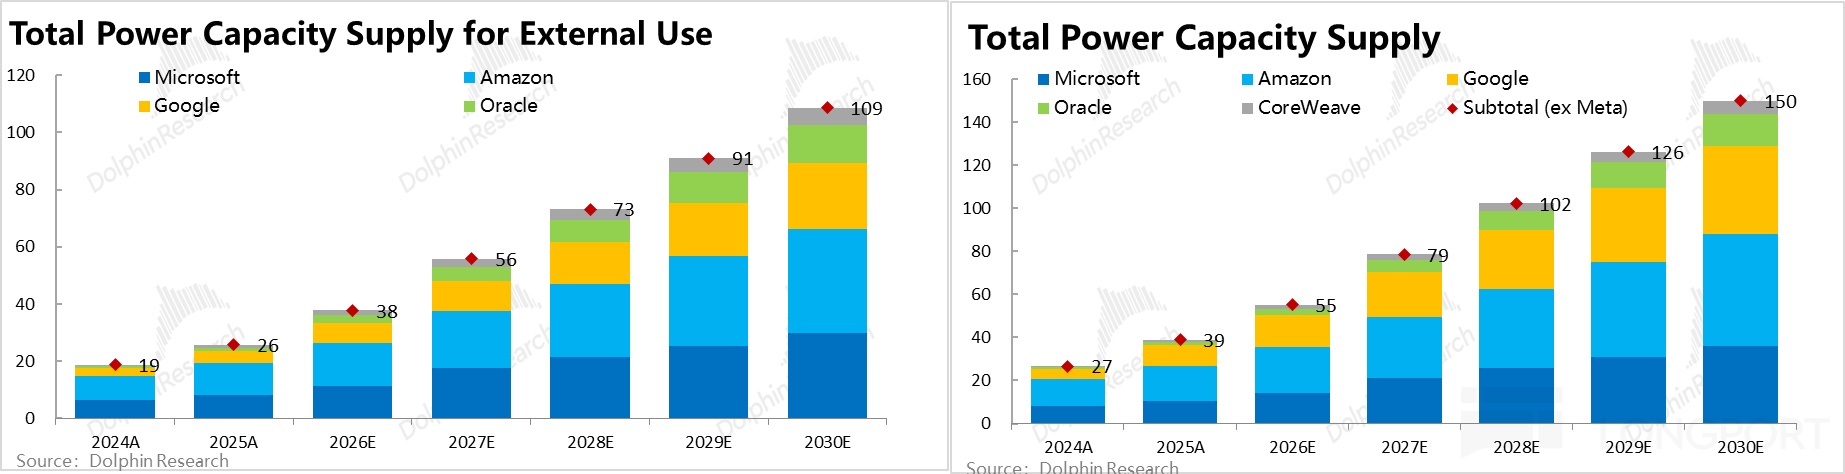
a) How much capacity will hyperscalers add? Aside from Oracle's 2030 target, most clouds guide capacity only through 2027 (often ~2x vs. 2025). We build 2028+ supply ramp using sell-side forecasts and adjustments.
We estimate total capacity across leading hyperscalers at ~100GW by 2028. After reserving internal needs, rental capacity is ~73GW, up ~47GW vs. 2025.
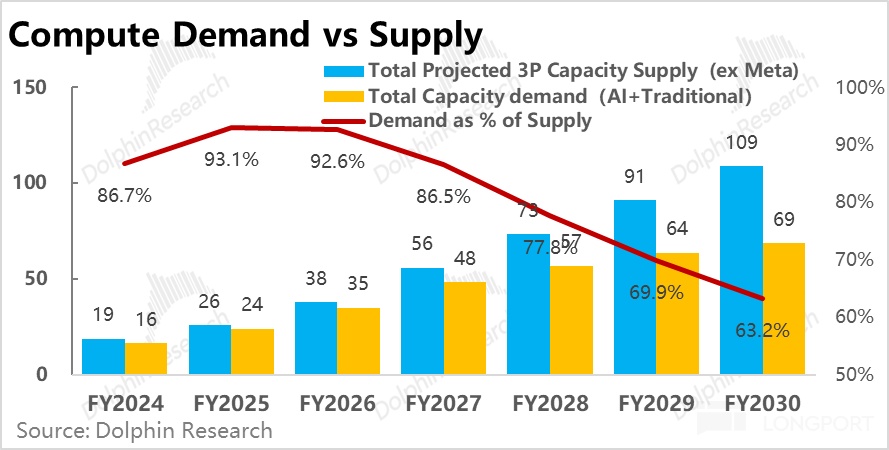
b) Surplus ahead? Our demand estimates imply combined AI + traditional needs of ~53GW by 2028, clearly below supply. In our model, 24–26 tighten (demand/supply goes from 87% to 93%), 27 resets to 2024 levels, and from 2028 a widening surplus emerges.
c) What would a potential surplus imply?
All of the above is scenario analysis. In reality, no one knows post-2026 demand or post-2027 supply with precision. The practical takeaway is that the current revenue run-rate assumptions for AI Labs (~$500bn combined by 2030) are insufficient to support the market's linear extrapolation of capacity additions and capex staying elevated through and beyond 2028.
We are not asserting a persistent surplus; new killer apps may emerge, or OAI/Anthropic may leap again in capability. The issue is that the market has already priced in 'unknown but assumed' large incremental AI demand, embedding it in capacity and capex expectations.
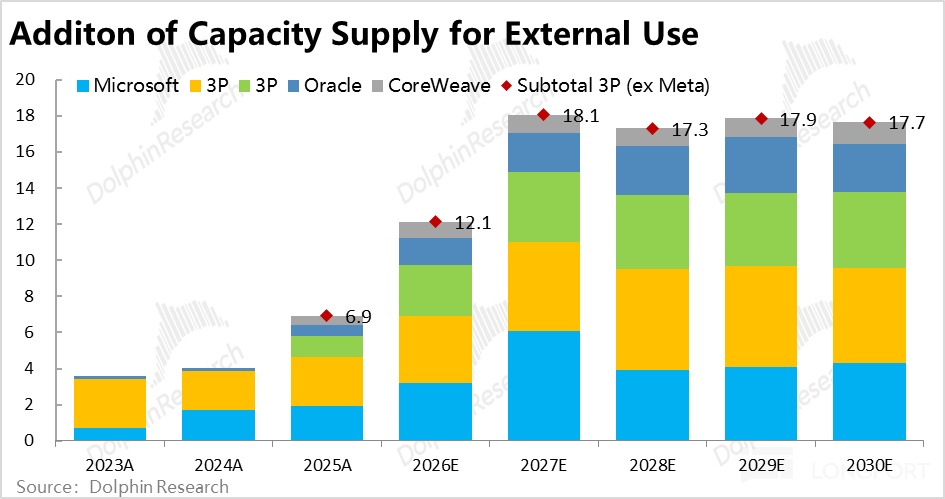
This means if AI progress is slower over the next 1–2 years, capacity additions and capex could peak as soon as 2027, even if they re-accelerate later when new use cases arrive.
Summary: Two key inferences. a) Across chips, clouds, and model providers, pricing power is shifting downstream toward clouds and models; models take the larger share, clouds the smaller. b) The market's linear assumption that compute buildouts and cloud capex stay high and do not fall meaningfully after peaking around 2027–28 effectively pre-prices incremental AI demand that is not yet visible.
For positioning, this is double-negative for upstream hardware, but mixed for clouds. a) For chip vendors (GPUs in focus; memory still the bottleneck), bargaining power is weakening as hyperscalers' in-house silicon has caught up on absolute perf. and may exceed on efficiency. To retain share, external chip suppliers will have to cede margin.
b) If capacity and capex peak in 2027 (even cyclically), the impact is larger upstream: hardware revenue depends on incremental builds, so a capex peak implies negative YoY, whereas cloud revenue is tied to installed base, so build deceleration merely slows growth. Given current sentiment, a sharp capex pullback and FCF recovery may outweigh slower cloud revenue growth.
c) Clouds are not immune. If supply temporarily exceeds demand, competition intensifies and performance will diverge, with winners likely those tightly aligned with AI Labs and capturing larger orders. But bidding for model contracts would erode hyperscalers' pricing power unless they reduce reliance on external models by boosting their own. On-demand rates would likely move from premium to discount, pressuring margins, partly offset by chip-efficiency gains. <End>
Past Dolphin Research on Amazon:
Deep Dives
Dec 18, 2024 'Amazon E-comm Endgame: Retail Wrapper, Ad Core?'
Earnings Reviews
Apr 30, 2026 call 'Amazon (Trans): A Once-in-a-Lifetime AI Investment'
Apr 30, 2026 review 'Retail Steady, AI Breaking Through: Amazon Back to the Top Tier?'
Feb 6, 2026 review '$200bn Arms Race! Amazon Takes AI to New Heights'
Feb 6, 2026 review 'Amazon (Trans): All New Capacity Absorbed Immediately'
Oct 30, 2025 call 'Amazon (Trans): Compute Supply to Double Again by 2027'
Oct 30, 2025 review 'AWS Reversal: Has Amazon Finally Turned the Corner?'
Risk disclosures and statements: Dolphin Research Disclaimer and General Disclosure
$Amazon(AMZN.US) $Microsoft(MSFT.US) $NVIDIA(NVDA.US)
The copyright of this article belongs to the original author/organization.
The views expressed herein are solely those of the author and do not reflect the stance of the platform. The content is intended for investment reference purposes only and shall not be considered as investment advice. Please contact us if you have any questions or suggestions regarding the content services provided by the platform.
