


 Rising Creator
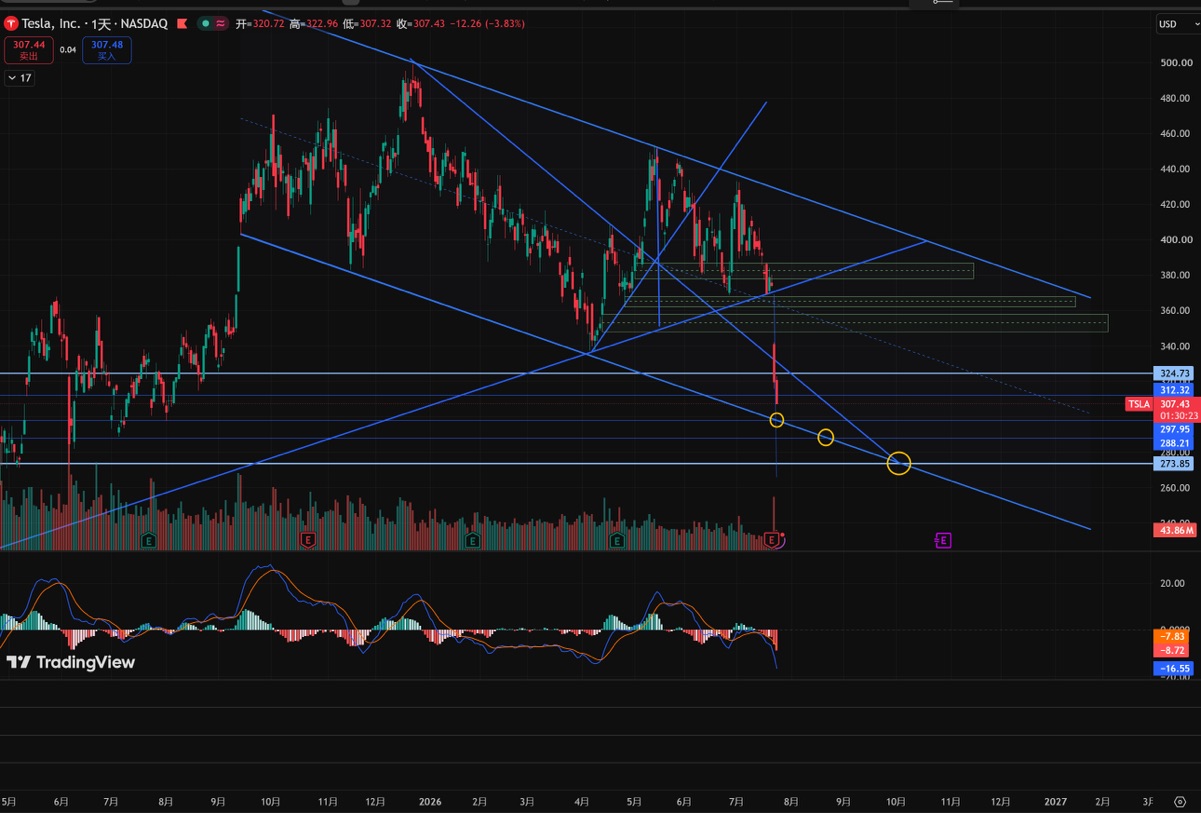
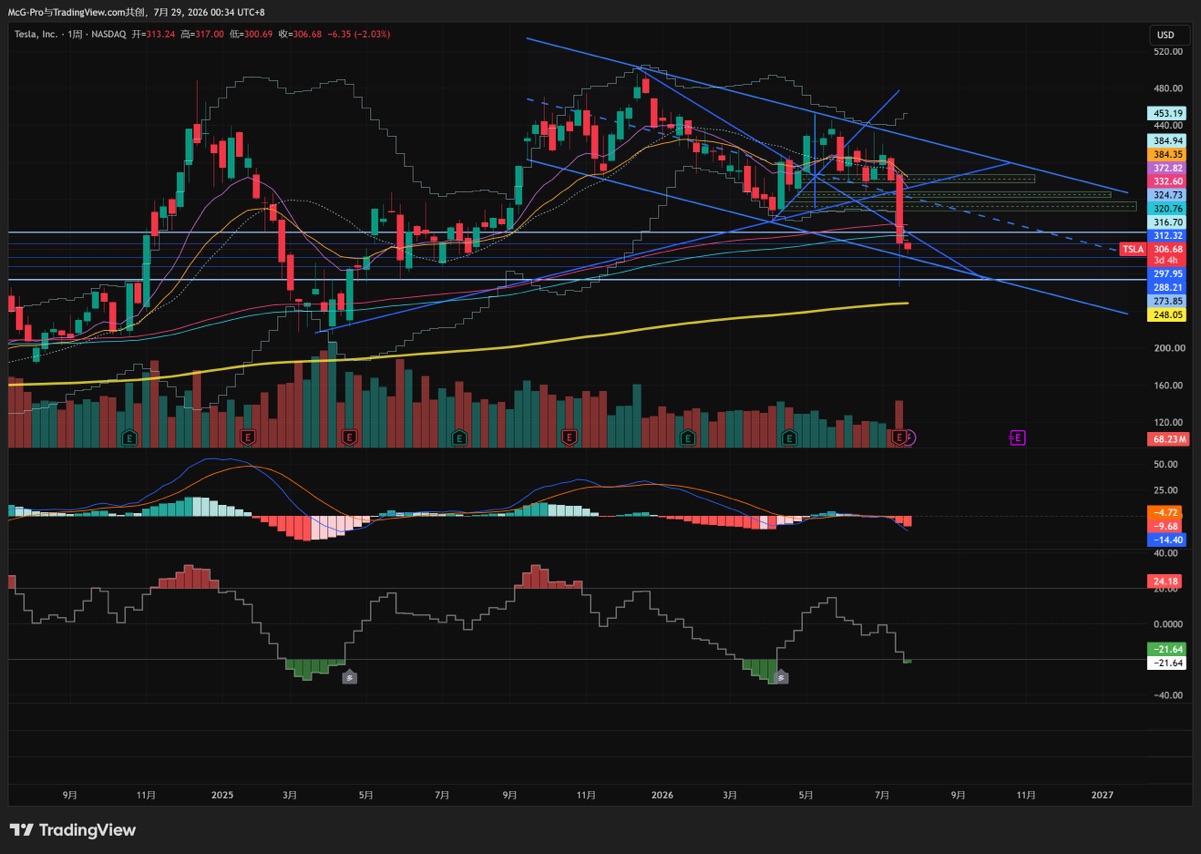
$Tesla(TSLA.US) pullback has reached the 1st layer position, hitting a low of 300.69 today. The weekly chart has triggered an oversold signal (the previous oversold signal was on March 30).

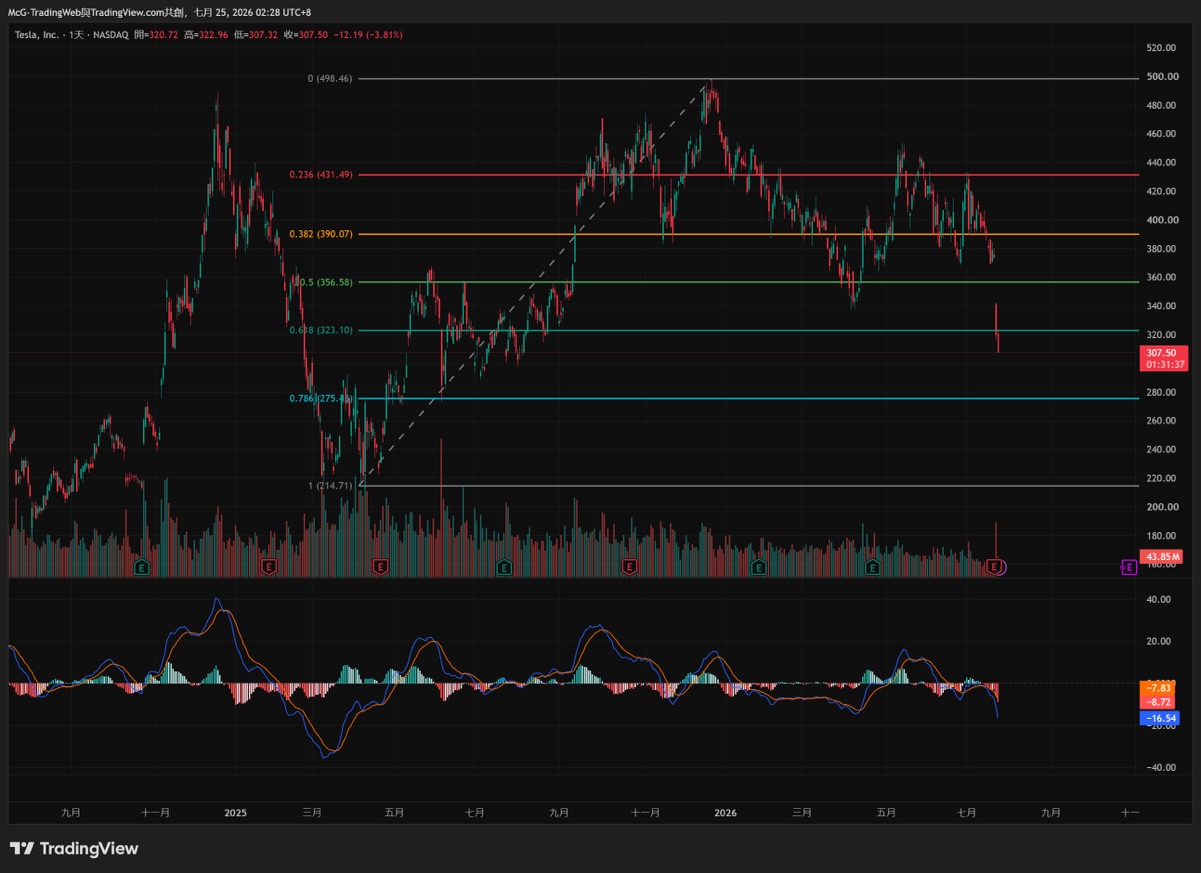
Tesla has currently entered the value zone, specifically the Fibonacci retracement levels of 0.618 to 0.786;
During the last major crash on April 7, I was very bullish on TSLA's long-term pullback to this zone for a bottom search, but unexpectedly, driven by positive news from US-Iran talks and Trump's TACO comments, it surged in one wave from 337 to 451, causing a short squeeze + bull trap, followed by two months of oscillation within a symmetric converging triangle;
Ultimately, leveraging the violent drop from the Q2 earnings report, it wiped out the bulls again (referring to those who gambled on the end-of-quarter earnings), revealing the cunning nature of the main players, which is hard to imagine;
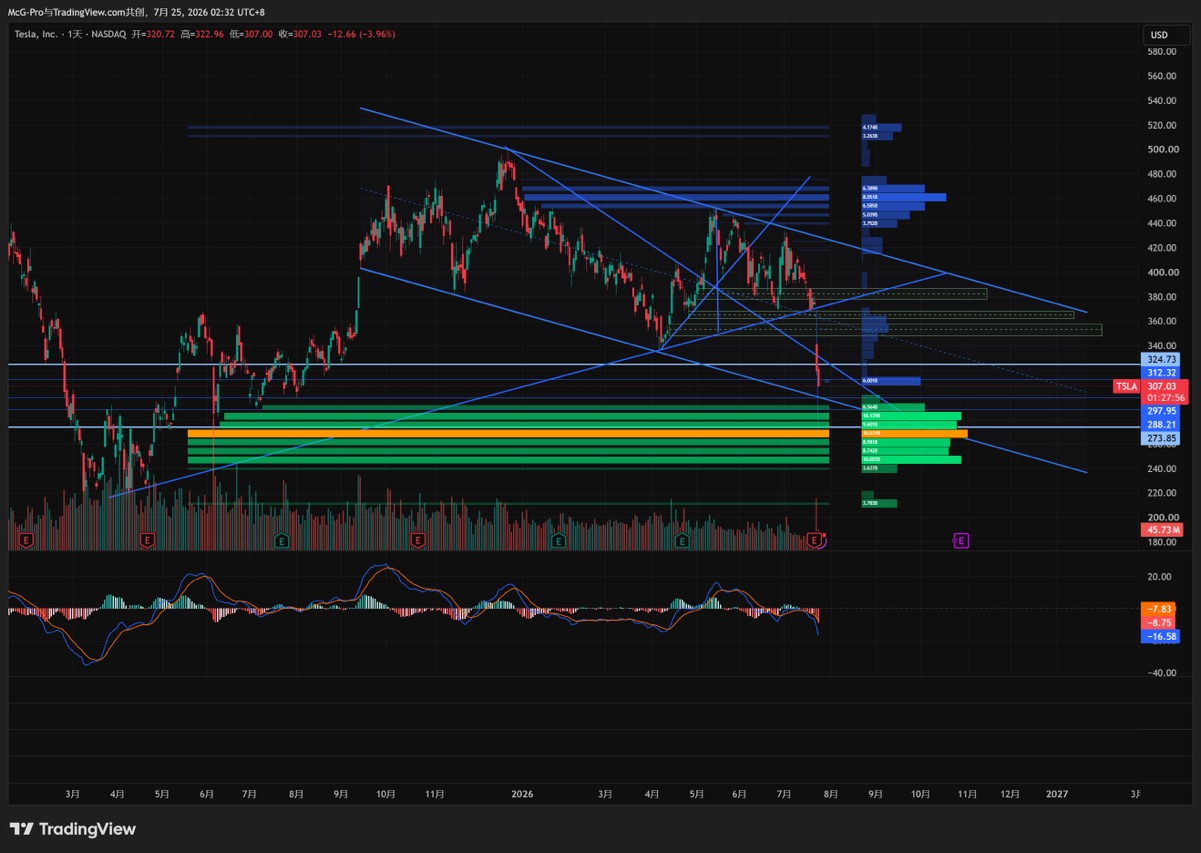
Tesla has now entered the value zone; next, we should focus on the following key levels:
1️⃣ Lower boundary of the parallel channel: 297-300
2️⃣ Secondary lower boundary of the parallel channel: 288-293
3️⃣ Fibonacci retracement 0.786: 273-275
(There is a large liquidity buy wall at 0.786; it may not be reached. It might bounce back up due to being detected by quantitative machines when testing the lower boundary of the parallel channel.)
For physical shares, a better strategy is to build positions in batches (personal view only, not investment advice)
$Tesla(TSLA.US)
 +3
+3
The copyright of this article belongs to the original author/organization.
The views expressed herein are solely those of the author and do not reflect the stance of the platform. The content is intended for investment reference purposes only and shall not be considered as investment advice. Please contact us if you have any questions or suggestions regarding the content services provided by the platform.
