


 Likes Received
 Posts
PostsMicrosoft chased highs by 22.41 million; Applied Materials dumped Puts in return
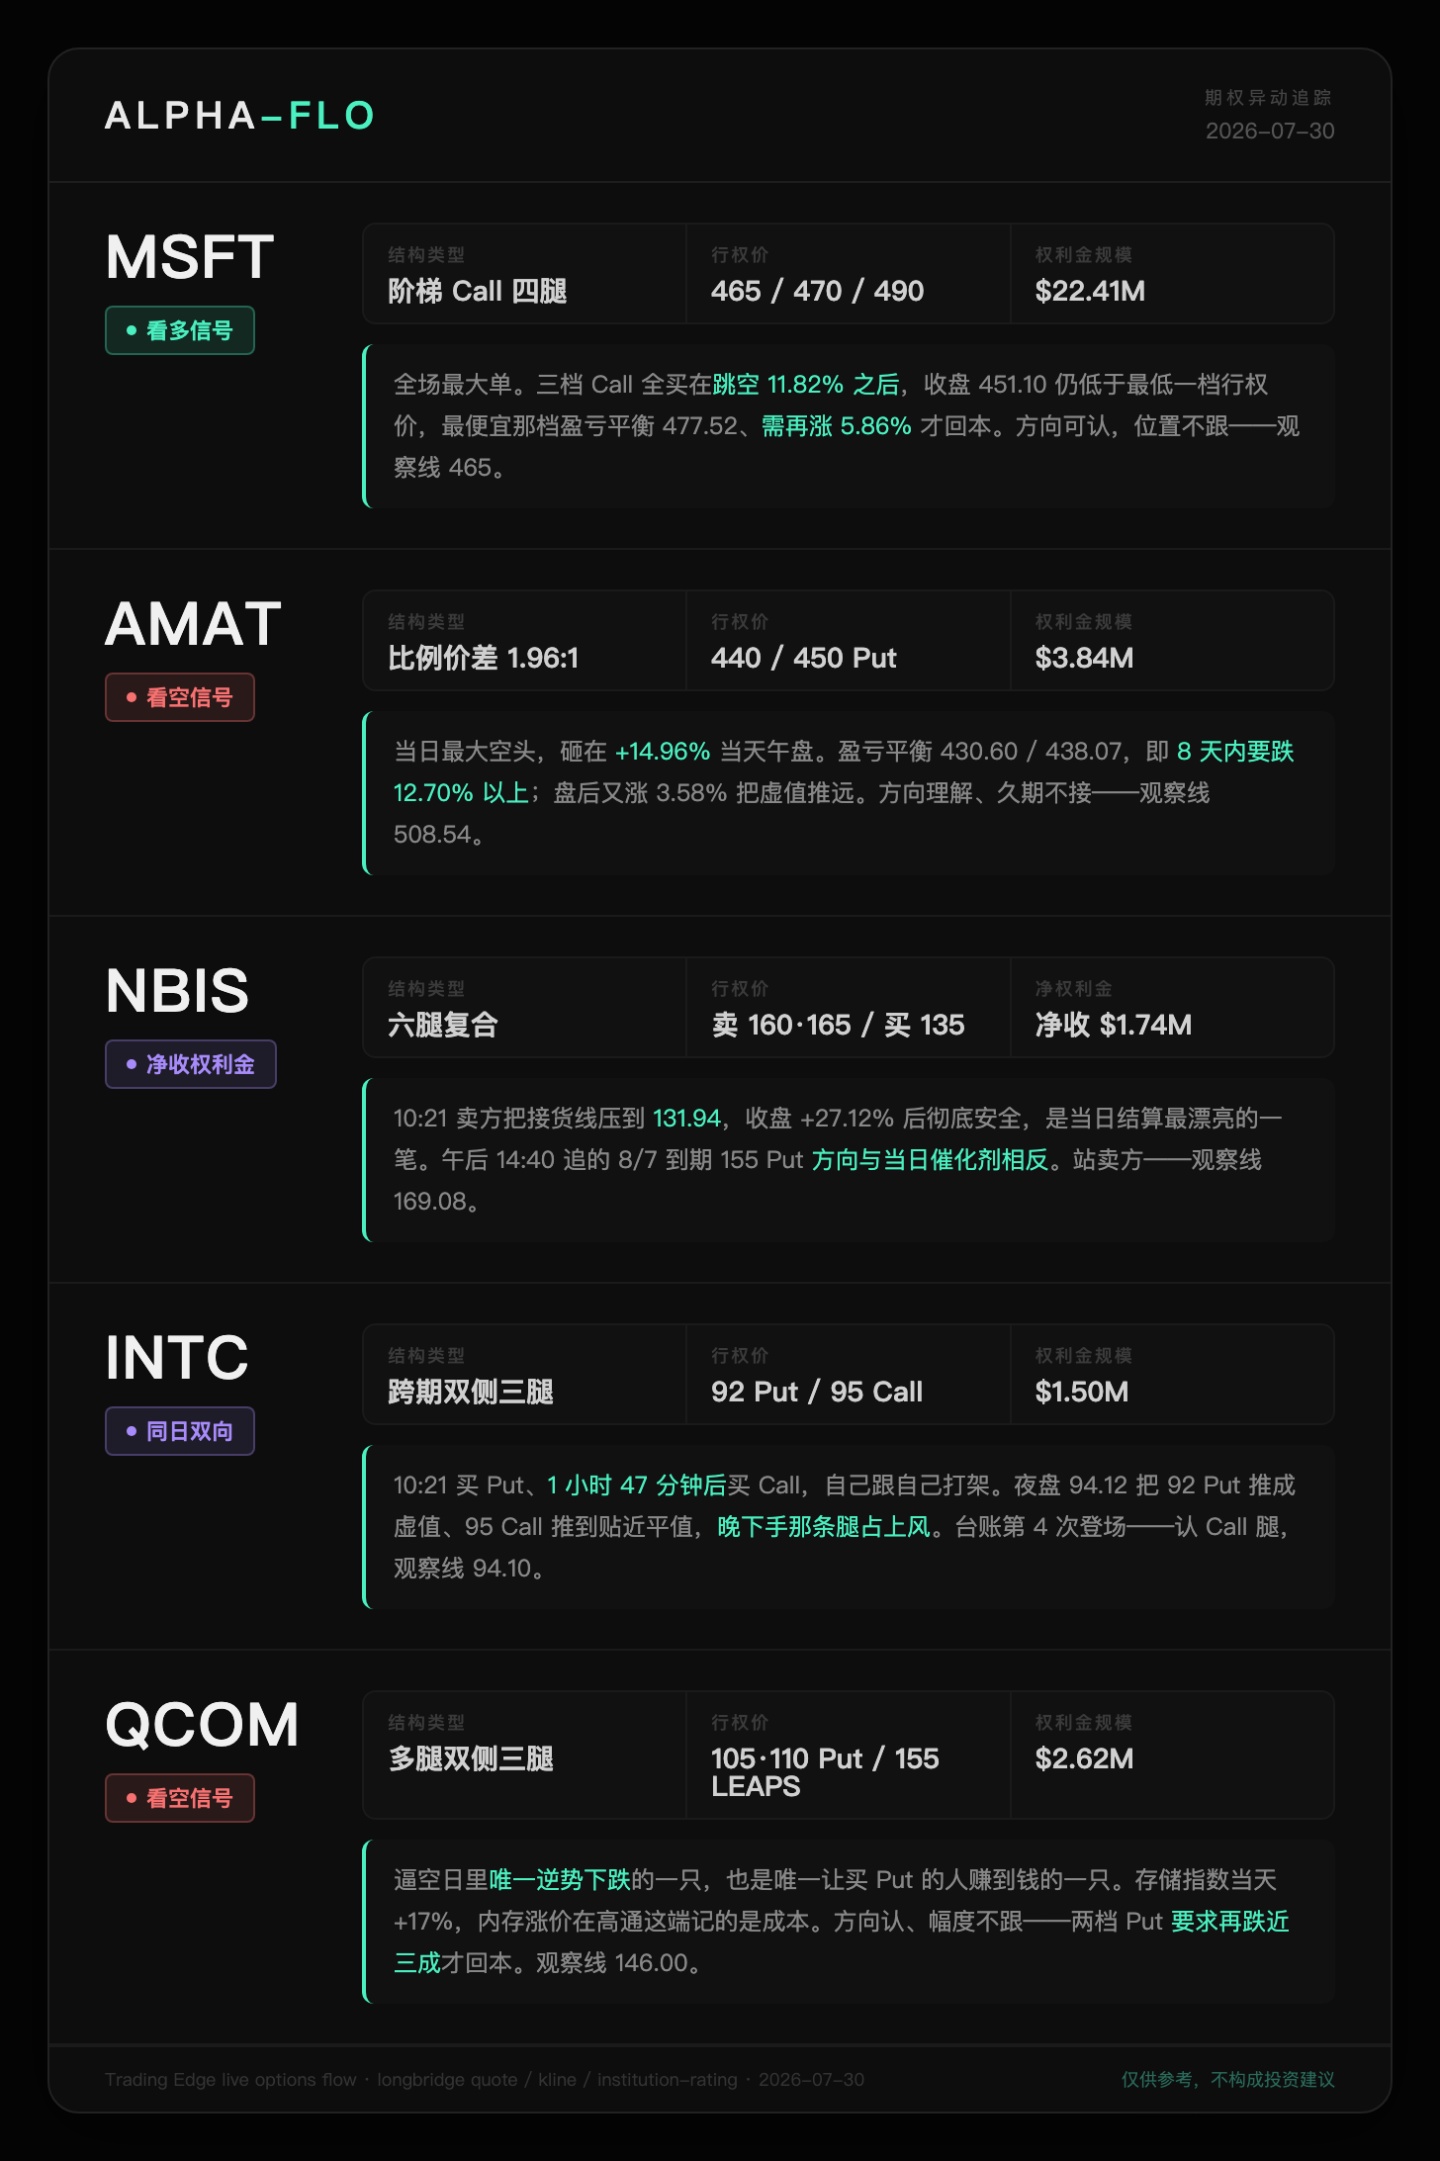
The Dow Jones Industrial Average plummeted by 1,153 points the previous day. On July 30, Microsoft's earnings report single-handedly pulled the entire tech sector back, with the Philadelphia Semiconductor Index rising 8.81%, ending a six-day losing streak. There were 200 unusual option activities, a long-to-short ratio of 2.8:1, and long positions totaling $103.8 million. However, the center of gravity in this market was extremely skewed—one-fifth of the long-side premium was concentrated on a single stock, while the largest short position that day was placed on a stock that had already risen by 15%.
$Microsoft(MSFT.US) Microsoft
Direction: 🟢 Bullish
Expiration Date: 2026-09-04 · 2026-09-18 · 2026-10-16 (with an additional leg selling on 2026-08-14)
Strike Price: $465 / $470 / $490 (Buy Call) · $465 (Sell Call)
Notional Size: Three tiers of Buy Calls totaling $22.41 million, plus an additional receipt of $193,000
Volume: 6,780 contracts + 9,953 contracts + 998 contracts + 213 contracts
Structure Type: Ladder Call Build-up (Four legs, including a same-price sell leg at the near end)
Data Highlights: The $12.74 million trade at the $470 strike was the largest single order in the session, with 9,953 contracts executed at once. The three tiers were laid out around the same minute; both the $470 and $490 strikes occurred at 10:25, while the $465 strike was split into three parts between 10:26 and 12:06. The key is the entry point: Microsoft gapped up 11.82% at the open, and all three trades were bought after the gap. The closing price was $451.10, up 15.50%, marking the best single-day performance since 2008, with the market cap increasing by nearly $450 billion in one day. However, the closing price was below the lowest of the three strikes, $465. Calculating the unit price by dividing the premium by the number of contracts, the prices are $12.52 / $12.80 / $11.82 per share. The break-even points are $477.52 / $482.80 / $501.82. Even the cheapest tier needs to rise another 5.86% to break even. After-hours trading dropped 0.58%, and night trading fell another 0.90%, indicating a pullback.
Bullish Viewpoint Comparison: The earnings report is solid. Q4 FY2026 revenue was $90 billion, beating the consensus estimate of $87.6 billion. Azure's constant-currency growth rate was 43%, higher than the expected 40%. Azure surpassed $100 billion for the first time in a full fiscal year. Copilot paid seats increased from 20 million in April to 30 million. EPS was $4.81. Goldman Sachs stated that Microsoft is showing Wall Street the monetization path for its AI investments. On July 30, sellers updated their consensus to 'strong buy' with a target price of $561.58. Out of 56 analysts, 40 rated it a strong buy and 0 rated it a sell. Even the lowest target of $400 is only 10% below the closing price. Fundamentals, seller sentiment, and options flow are all aligned.
My Viewpoint: I agree with the direction, but not the timing. This $22.41 million represents chasing the rally after the earnings release. If the same capital had entered at $390.54 before the close on July 29, the cost would have been 13% lower. Instead, they chose to enter after a 12% gap up, giving up the thickest part of the move, resulting in all three tiers being out-of-the-money at the close. The duration of DTE 36 to 78 is the only safety cushion for this trade, allowing enough time for a second wave. I am not following any of these three tiers. $465 is the observation line; it is the lowest strike price, and this trade only starts making real money if the price stands above it. Night trading has already seen two consecutive sessions of retracement, so let's see if it holds the opening price of $437.90.
Source: Trading Edge live options flow (Locally collected 2026-07-30)
$Applied Materials(AMAT.US) Applied Materials
Direction: 🔴 Bearish
Expiration Date: 2026-08-07 (Two tiers simultaneous)
Strike Price: $440 / $450 (Buy Put)
Notional Size: Two tiers totaling approximately $3.84 million, the largest short position of the day
Volume: 2,478 contracts + 1,266 contracts
Structure Type: Approximate Ratio Spread (Simultaneous cross-strike, volume ratio 1.96:1, lower tier as main leg)
Data Highlights: The $440 tier was placed in three batches between 11:50 and 12:53, and the $450 tier in two batches between 11:27 and 11:58. All orders were placed during the afternoon session, i.e., after Applied Materials had already risen by more than 10% that day. The closing price was $501.77, up 14.96%, with an intraday high of $508.54. The unit prices are $9.40 and $11.93 per share, with break-evens at $430.60 and $438.07. This means the stock needs to fall 12.70% to 14.18% from $501.77 within 8 days to break even. After-hours trading rose another 3.58% to $519.75, and night trading was at $508.77, meaning the out-of-the-money status of both tiers is widening. The background is that Applied Materials fell from $553.92 on July 22 to $436.45 on July 29, shrinking by 21.21% over five trading days. The jump on July 30 was driven by the Philadelphia Semiconductor Index rising 8.81%, with peers like Lam Research rising over 20% and Micron rising 14%.
Bullish Viewpoint Comparison: Sellers stand directly opposite this trade. Consensus is 'strong buy' with a target price of $627.66. Out of 39 analysts, 28 rated it a strong buy and 0 rated it a sell. The lowest target of $358 is only 71% of the closing price. The rationale supporting this Put is rhythm rather than valuation: a single-day 15% rebound after a five-day drop of 20% is indeed sharp, and the rebound relies on spillover effects from Microsoft's earnings, not an improvement in equipment orders itself.
My Viewpoint: I understand the logic, but I don't accept the duration. The problem with this trade is not the direction but the timeframe—it requires Applied Materials to fall back below $440 from $501.77 before August 7, while the sector has just pulled it up, and after-hours/night trading continues to rise. If the same bearish capital were placed in October or November, the win rate would be completely different. I am not following. $508.54 is the observation line; if it stands above the July 30 intraday high, these two tiers are basically invalid. Conversely, only if it falls back to the daily intraday low of $476.12 does this trade return to the table.
Source: Trading Edge live options flow (Locally collected 2026-07-30)
$Nebius(NBIS.US) Nebius
Direction: 🟣 Hedging/Neutral (Net premium receiver, seller-dominated)
Expiration Date: 2026-10-16 (Five legs) · 2026-08-28 · 2026-08-07
Strike Price: $165 / $160 / $190 (Sell Put) · $135 / $175 / $155 (Buy Put) · $260 (Buy Call)
Notional Size: Seller received $4.59 million, buyer paid $2.85 million, net receipt approx. $1.74 million
Volume: 633 + 898 + 30 contracts (Sell) · 1,171 + 46 + 1,292 contracts (Buy) · 200 contracts (Call)
Structure Type: Multi-leg Composite Structure (Six legs, Put Credit Spread + OTM Call + Afternoon Additional Protection)
Data Highlights: At 10:21 in the same minute, three tiers of October expiration Puts were sold for $4.59 million, while simultaneously buying the same expiration $135 Put for $1.87 million, forming a credit spread. At 10:26, an additional $260 OTM Call for $260,000 was bought to retain upside exposure. Later in the afternoon, other funds took the opposite side: at 14:06, $175 Puts were bought for $156,000, and at 14:40, August 7 expiration $155 Puts were bought for $562,000. The settlement result is a big win for the sellers: Closing price $188.43, up 27.12%, intraday high $195.89, after-hours $199.00, night trading $199.09. For the $165 and $160 tiers, the calculated exercise cost is $134.35 and $131.94 respectively, meaning the seller's stance is 'I will still take delivery even if it drops 30%,' and these two tiers are now completely safe. The money spent on buying Puts in the afternoon was invested at the worst position of the day.
Bullish Viewpoint Comparison: The direct reason for the 27.12% gain that day was Nebius announcing a multi-year contract to sell computing power to Reflection AI, worth over $1 billion with a term until 2029. Pre-market trading pushed the stock up over 4%, followed by a short squeeze across the entire data center sector, with IREN rising 27% and HUT rising 22%. It is necessary to distinguish the 'Meta $27 billion order' often cited together—this was a five-year contract signed in March, starting execution in 2027, not a new catalyst on July 30. Including it in the reasons for the daily gain would overestimate the sustainability of this wave. Seller consensus is 'buy' with a target price of $258.13. Out of 18 analysts, 10 rated it a strong buy and 0 rated it a sell.
My Viewpoint: I stand with the sellers at 10:21. Their entry point was at the low level after Nebius fell from $218.16 to $148.22, shrinking by 32.06% over seven trading days. They set the delivery line at $131.94, using the logic that it has fallen to the bottom rather than the logic that it is about to rise immediately, which is more stable than chasing Calls. I explicitly do not follow the August 7 expiration $155 Put bought at 14:40 in the afternoon: it makes no sense unless it falls 17.7% from $188.43 within 8 days, and the direction is completely opposite to the day's catalyst. The observation line is $169.08, the July 30 intraday low. A fall back to this level indicates that this short squeeze is only a one-day event, and the seller's 30% buffer needs to be recalculated.
Source: Trading Edge live options flow (Locally collected 2026-07-30)
$Intel(INTC.US) Intel
Direction: 🟣 Hedging/Neutral (Bidirectional on the same day, Call legs dominant)
Expiration Date: 2026-08-21 · 2026-08-07 · 2026-09-04
Strike Price: $92 (Buy Put) · $95 / $100 (Buy Call)
Notional Size: Put $877,000, two tiers of Calls $471,000 plus $151,000, totaling approx. $1.5 million
Volume: 1,185 contracts · 1,135 contracts · 200 contracts
Structure Type: Cross-period Bidirectional Structure (Three legs, Buy Put first then Buy Call)
Data Highlights: The same stock fighting itself on the same day. At 10:21, August 21 expiration $92 Puts were bought for $877,000, 1,185 contracts; 1 hour and 47 minutes later at 12:08, August 7 expiration $95 Calls were bought for $471,000, 1,135 contracts; at 10:29, there was another September 4 expiration $100 Call for $151,000. The Put bid price was higher than the sum of the two Call legs. Closing price $91.13, up 11.29%, intraday high $94.10, after-hours $95.28, night trading $94.12. Calculated by unit price, the break-even for the $92 Put is $84.60 and for the $95 Call is $99.15. The night trading price of $94.12 pushes the Put into out-of-the-money territory and brings the Call close to at-the-money, meaning the later-entering leg actually gained the upper hand.
Bullish Viewpoint Comparison: Intel's gain on July 30 came from the sector, not from itself—the Dow rose 613 points, the Nasdaq rose 2.78%, and chip stocks had a 报复式 (retaliatory) rebound. Its own Q2 earnings were reported early on July 23 and significantly exceeded expectations: Revenue $16.13 billion, up 25.4% YoY; non-GAAP EPS $0.42 vs expected $0.22; Data Center and AI business grew 59% to $6.26 billion; Foundry business grew 31% to $5.76 billion; Q3 guidance $15.8 to $16.8 billion. Sellers still do not buy in: Consensus is 'hold' with a target price of $115.27. Out of 52 analysts, 31 hold, 2 sell, and 1 reduce, with a target price range of $74 to $200, showing extreme divergence.
My Viewpoint: I recognize the Call leg, but not the Put leg. Intel has appeared for the 4th time in my ledger—July 23 three-leg combination verified by earnings, July 28 bet $19.83 million into 2027, July 29 added a near-month Put for the first time appearing as an insurance leg, July 30 became bidirectional on the same day. With such repeated directional changes, I only look at which leg is profitable: The cost zone for the July 28 2027 LEAPS was around $86.30, and night trading at $94.12 has already pulled it above water, making it the most comfortable position on this line; the July 30 $92 Put was bought on the first day of the sector reversal, the worst position. The observation line is $94.10, the July 30 intraday high. If it stands above this, the $95 Call enters the in-the-money zone.
Source: Trading Edge live options flow (Locally collected 2026-07-30)
$Qualcomm(QCOM.US) Qualcomm
Direction: 🔴 Bearish (Put legs dominant, with reverse LEAPS)
Expiration Date: 2026-11-20 (Two tiers) · 2027-02-19
Strike Price: $105 / $110 (Buy Put) · $155 (Buy Call)
Notional Size: Two tiers of Puts totaling $1.39 million, LEAPS Call $1.23 million, totaling approx. $2.62 million
Volume: 2,355 contracts + 2,101 contracts · 498 contracts
Structure Type: Multi-leg Bidirectional (Three legs, two simultaneous Puts plus late-session far-month Call, judged as different capital)
Data Highlights: The only stock falling against the trend on the day of the market-wide short squeeze, and also the only one in this batch where buyers of Puts made money. At 10:41, November 20 expiration $105 Puts were bought for $652,000, 2,355 contracts; at 11:57, same expiration $110 Puts were bought for $735,000, 2,101 contracts, with a 76-minute interval between the two. Closing price $151.60, down 2.62%, intraday low $146.00. These two tiers are not short-term: Unit prices are $2.77 and $3.50 per share, break-evens are $102.23 and $106.50. It needs to fall another 29.75% to 32.57% from the close to break even, betting on a significant downward revision before year-end. At the close at 15:12, there was another February 2027 expiration $155 Call for $1.23 million, 498 contracts. The strike price is only 2.24% higher than the close, with a break-even of $179.70, completely opposite in direction to the previous two.
Bullish Viewpoint Comparison: Three pieces of bad news landed simultaneously on July 30—the company itself warned that rising memory costs are impacting its mobile business; Citigroup lowered its target price to $175 and simultaneously lowered its 2026-28 fiscal year earnings forecasts while maintaining a neutral rating; TD Cowen also lowered it to $175. Seller consensus target price was revised down from $220.57 to $199.43 in one day. Consensus remains 'hold', with 23 out of 38 analysts holding. The stock price fell from $175.63 to $151.60 over seven trading days, a cumulative shrinkage of 13.68%.
My Viewpoint: I stand with the direction of the Put line, but not the magnitude. July 30 provided a very clean comparison—the Memory Chip Index rose 17% that day, while Qualcomm fell due to memory price hikes. The same event is recorded as revenue on one end of the industry chain and cost on the other. This cost squeeze cannot be digested in one quarter, so I recognize the direction of the two November Puts. But requiring another 30% drop to break even treats a profit margin revision as a business collapse, which I do not follow. This is the 3rd time Qualcomm appears in my ledger: July 14 judged it as biased towards short volatility, with Puts 60% heavier than Calls; the July 29 $175 Call ordered hours before earnings was wrong; the short side on July 30 continues to play out. I watch but do not act on the late-session 2027 LEAPS. The break-even of $179.70 is still below the revised consensus of $199.43, which makes sense in the model, but for it to win, it must prove that the memory cost line is short-term—betting on the same issue as the two Puts on the same day, but with opposite answers. The observation line is $146.00, the July 30 intraday low.
Source: Trading Edge live options flow (Locally collected 2026-07-30)
The first to show results will be August 7. Applied Materials' two tiers of $440 and $450 Puts, Intel's $95 Call, and Nebius' afternoon chase of the $155 Put are all pressed onto this same expiration date, with contradictory directions, settling once after 8 days. Further out are Microsoft's $465 tier on September 4, and Qualcomm's two Puts on November 20. The overnight Asian session has already given a preview: KOSPI rebounded over 17%, SK Hynix surged nearly 30%, Samsung rose 23%. This semiconductor repair wave is not yet finished. Before August 7, the time cost for the short side will be much higher than for the long side.
The copyright of this article belongs to the original author/organization.
The views expressed herein are solely those of the author and do not reflect the stance of the platform. The content is intended for investment reference purposes only and shall not be considered as investment advice. Please contact us if you have any questions or suggestions regarding the content services provided by the platform.
