


US/Japan smash through last week's lows! US oil suffers a heavy blow from TACO
Crude Oil (Crude) – Hit Hard by TACO Again, Initial Lower Trendline Preserves Hope for a Stop in the Decline
Looking at the Daily Chart, Trump once again deployed extreme TACO tactics; after announcing a halt to strikes on Iran, he stated that negotiations are about to restart. Crude oil opened lower and continued to fall at the start of the week, with only a slight rebound, still showing a gap of around $5 compared to Friday's close (July 31). This means the strong attempt to rally over the last three days of last week has been dealt another heavy blow. However, the initial uptrend's lower trendline from July is currently forming a combined support with the April low of 79.00, creating the last line of defense for bulls to maintain their advantage. A break below would likely slide towards the sharp crash low of March 10 at 75.85 and the mirror level of late June at 72.40. Regarding indicators, the MACD formed another death cross above the zero axis; the RSI is turning downwards towards the neutral zone, revealing signs of renewed market pressure.
Looking at the 4-Hour Chart, the short-term swing highs and lows created by crude oil over the past weekend were almost destroyed at the start of the week. However, if the bull line formed by the aforementioned dual supports can be held, it will also form a double-bottom pattern with the low of July 28. In terms of potential to stop the decline, the gap at the start of the week above, along with the 81.85 level between them (the 38.2% retracement level of the long-term uptrend from 2020-2022), are immediate stubborn resistances that bulls urgently need to overcome. Moving higher, it will once again face the 84.80 level (converging multiple inflection points such as the lows of March 23 and June 9) which could not be breached last week, and even the lower edge of another weekly gap at 86.70. Regarding indicators, the MACD formed a death cross below the zero axis; the RSI has fallen back into the weak zone, similarly highlighting the risk of a price reversal to the downside.
Resistance Levels: 81.85, 84.80, 86.70
Support Levels: 79.00, 75.85, 72.40
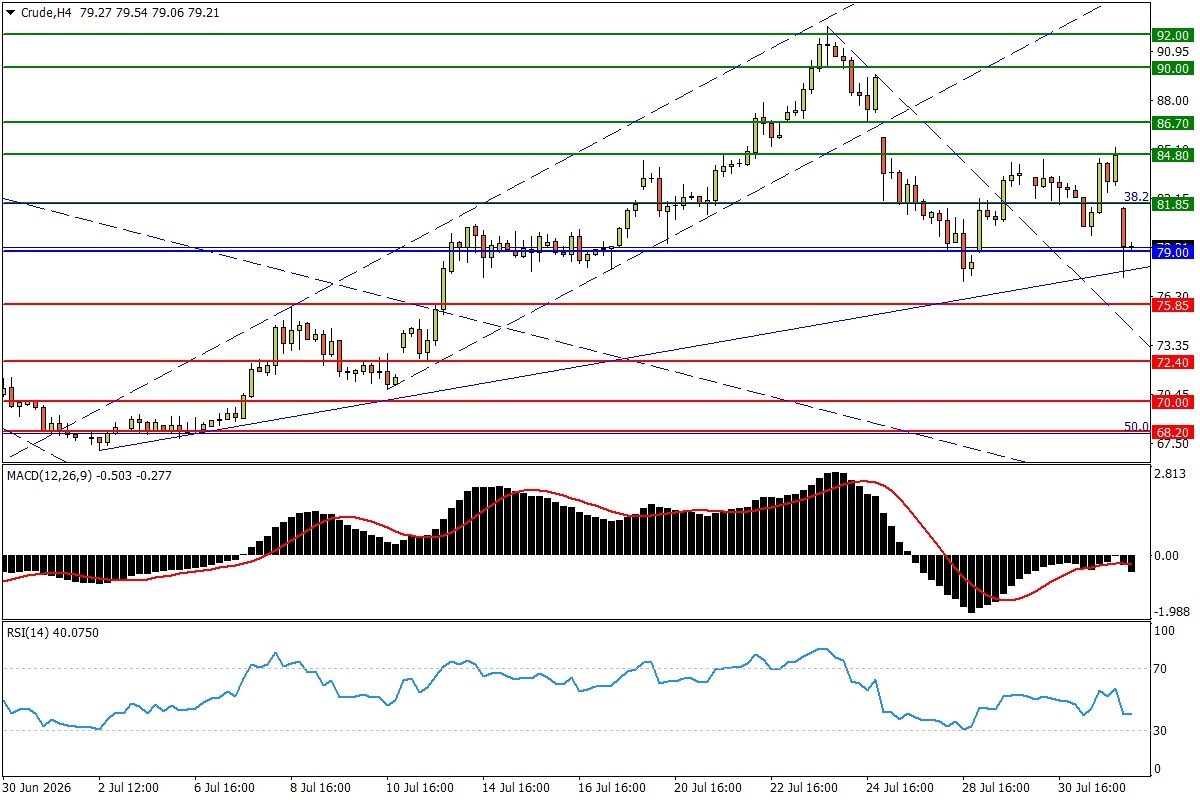
*Crude H4 Source: FXTM
AUD/USD – Holding Firm Above Dense Previous Highs, Gradually Detaching from Lower Trendline Pull
Looking at the Daily Chart, although economic data such as Chicago PMI still highlights US economic resilience, Walsh did not clearly guide future policy tightening expectations after the interest rate meeting, so the USD remained weak over the past weekend. Amidst the extreme tug-of-war among non-US currencies, the technical setup for AUD/USD is relatively simple and clear: After breaking through the dense resistance near recent highs (around the February 20 low of 0.7015) with a engulfing bullish candle on Thursday (July 30), the exchange rate oscillated slightly upward, further consolidating its foundation for the rise. The market also used this opportunity to temporarily avoid the risk of a sell-off associated with realizing profits from the rising flag pattern. Regarding indicators, the MACD fast line 率先 reclaimed the zero axis; the RSI continued its upward trend in the strong zone, with the market standing on the threshold of transitioning from a weak to a strong trend.
Looking at the 4-Hour Chart, AUD/USD experienced some oscillation in the latter part of last week but still re-targeted the 38.2% retracement level of the 2020-2021 uptrend at 0.7050 above. Breaking through this will face the area of two swing lows from late May at 0.7080-0.7100. Conversely, if a pullback causes the loss of the 0.7015-0.70 level, the market may fall back into entanglement with the lower trendline of the long-term uptrend since April last year. Meanwhile, the low of June 11 at 0.6980, the half-way point of the aforementioned uptrend at 0.6960, and the 2024 high of 0.6943 are all dense "lower trendline backups." Regarding indicators, the MACD is expanding its upward trend above the zero axis; the RSI touched the overbought line and volatility increased, overall presenting a strong spot exchange rate.
Resistance Levels: 0.7050, 0.7080, 0.7100
Support Levels: 0.7015, 0.6980, 0.6960
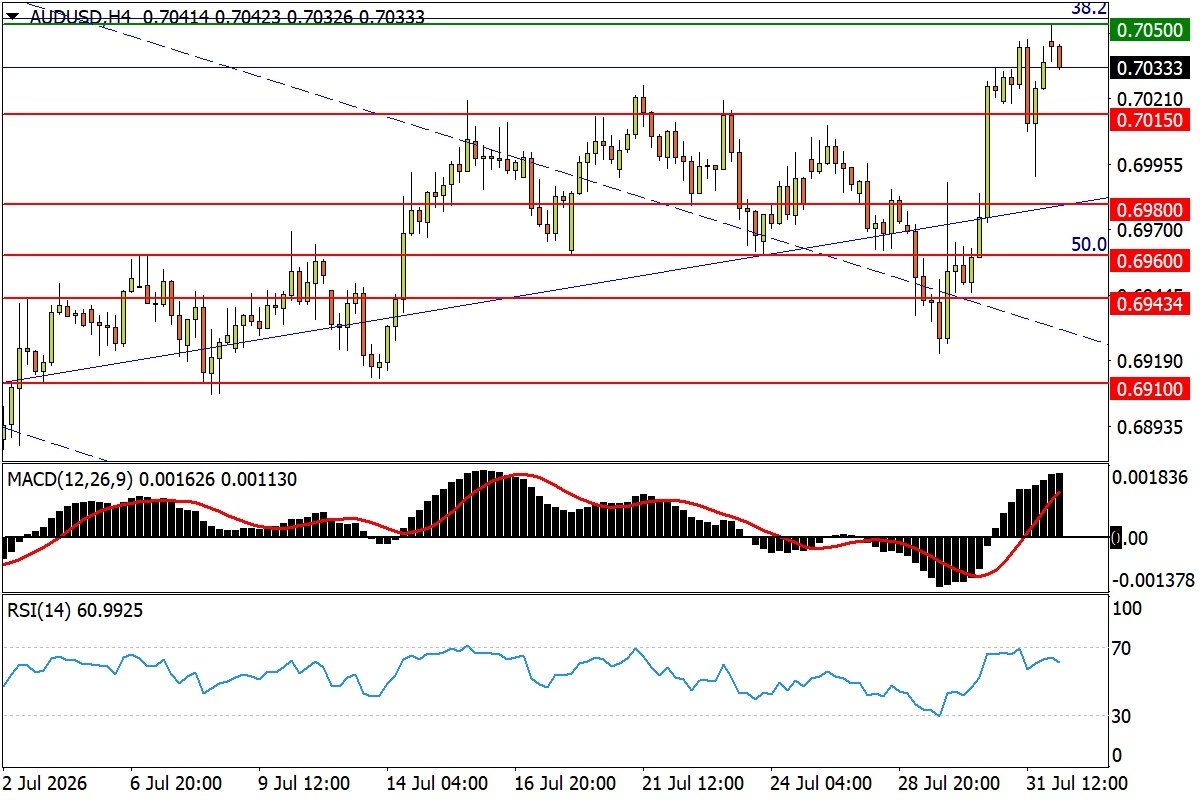
* AUD/USD 4-Hour Chart
USD/JPY – Intervention Statements Trigger Another Sell-Off, Short-Term RSI Divergence Intensifies
On the Daily Chart, USD/JPY accelerated its breakdown and decline at the start of the week because both the US and Japan stated in the morning session that they would unhesitatingly jointly implement further forex intervention. As a result, there is no longer any hope to save the lower trendline of the uptrend since April last year; the immediate point of contention revolves around the May 7 low of 156.00. Subsequently, below the support of the May valley low of 155.00 to the lowest point of the double bottom in December last year at 154.40, the connecting line of lows from January and October 2021 is expected to safeguard the long-term uptrend of the exchange rate. Regarding indicators, the MACD fast line quickly opened up space below the zero axis, with the gap between the two lines widening sharply; the RSI plunged deep into the oversold zone, and the indicator's bearish divergence has become extreme.
Looking at the 4-Hour Chart, USD/JPY continued the new round of brutal sell-off from the end of last Friday (July 31). Short-term oscillation indicators are also severely oversold: the MACD shows no sign of stopping the decline deep below the zero axis; however, the RSI already shows signs of upward divergence in the oversold zone. Besides urgently needing to hold firm at the 156.00 level, the bulls must further quickly recover resistances such as the December 9 high of last year at 156.90 and the Q4 double high of 157.57 to demonstrate market elasticity and reveal early signs of a stop in the decline. Subsequent resistance levels reference the 61.8% retracement level of the May-July uptrend at 158.45, and the January high of 159.45 (half-way point of the uptrend).
Resistance Levels: 156.90, 157.75, 158.45
Support Levels: 156.00, 155.00, 154.40
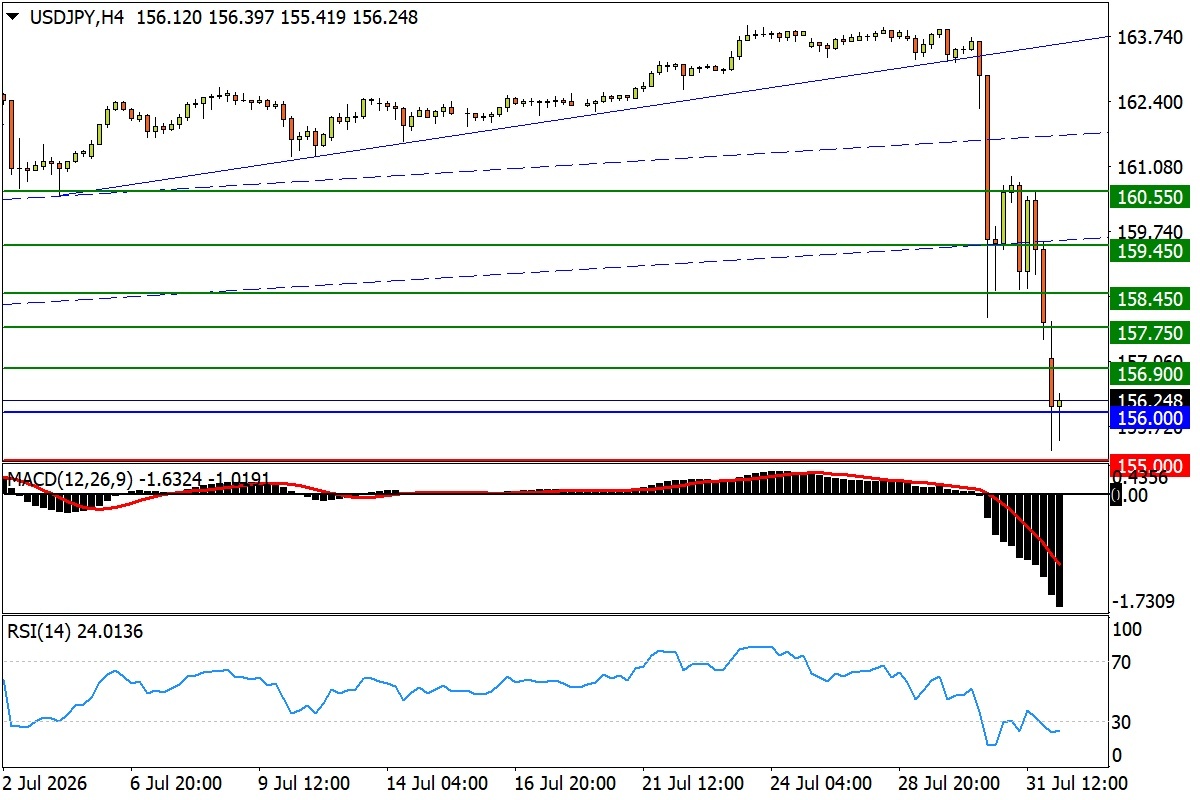
* USD/JPY 4-Hour Chart
Dow Jones Industrial Average (US30) – Approaching Fill of Mid-Yellow Candle Drop, Recent Uptrend Framework Intact
Looking at the Daily Chart, after the big drop on Fed decision day, the Dow Jones made up for the deep hole for two consecutive days. Although it "reacted slowly" in the counterattack wave of AI semiconductors, the index still held the lower trendline of the uptrend since the end of April, maintaining the most favorable posture among the three major indices. Currently, the 53000 level (reverse 1.618x mapping level of last year's tariff shock decline) up to the record high is within the attack range of the bulls. Breaking through will accelerate the current uptrend, with subsequent targets pointing sequentially to the reverse 1.618x mapping level of the Feb-Mar decline at 54075, and the 55000 level. Regarding drawdown risks, the previous swing high of June 17 at 52280 and the lower trendline create an immediate support that cannot be lost; a break below will make the stubbornly unbroken 53000 level exert greater deterrence. If the key mirror level of mid-to-late June at 51300 is broken again, the market will be suspected of forming a short-term top; downwards it will directly face the February weekly prior high of 50540. Regarding indicators, the MACD fast line stopped falling above the zero axis; whether it will form a golden cross will be the key to the continuation of the rally; the RSI maintains strong-side oscillation in the neutral zone, with the market once again at a crossroads of direction selection.
Resistance Levels: 53000, 54075, 55000
Support Levels: 52280, 51300, 50540
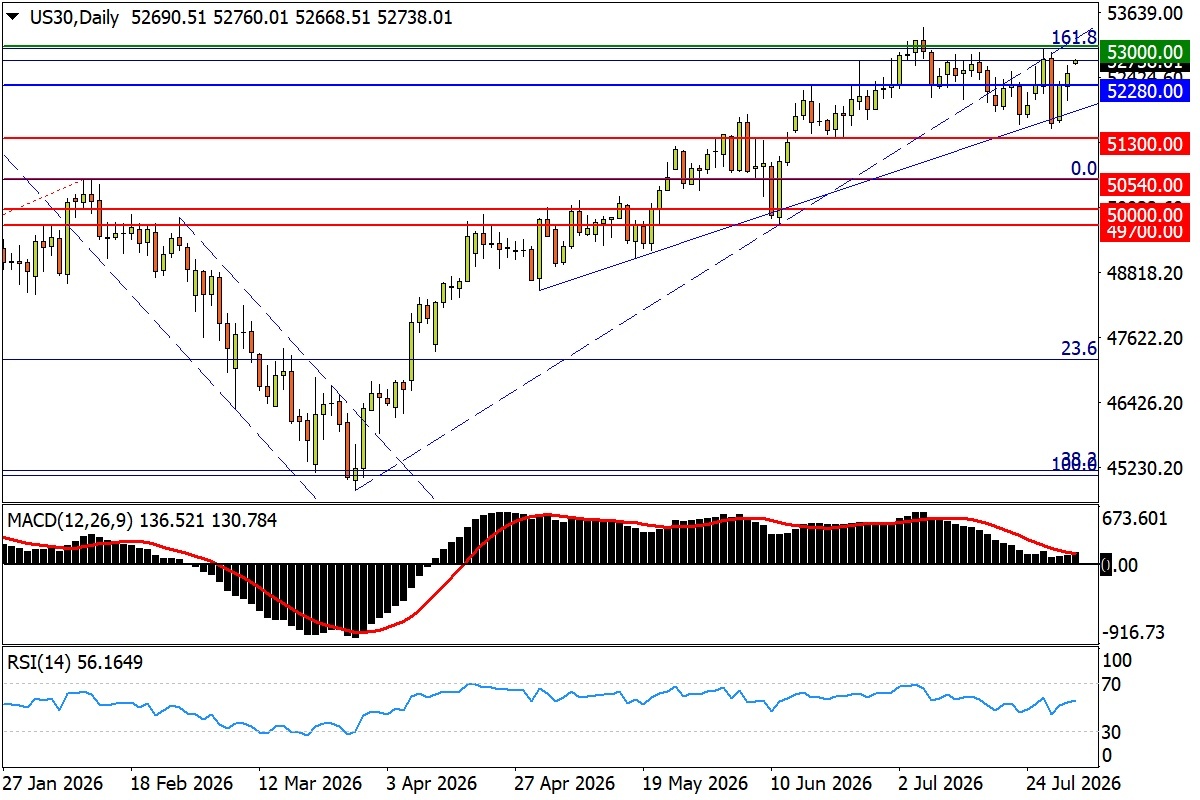
* US30 D1 Source: FXTM
XAU/USD – Slightly Higher Open and Stabilized at 4000, Still Insufficient to Break the Balance
Looking at the Daily Chart, signals of improvement in the Middle East situation gave gold some upward momentum at the start of the week, but the strength to break the recent sideways consolidation pattern remains insufficient. Without more external event-driven catalysts, gold prices may continue to maintain a stable sideways consolidation pattern in the early part of this week. In terms of price levels, the range from 4025 (double low of June 11 and July 8) to 4000 resisted bear attacks again in the latter part of last week, joining the already broken top side of the May downtrend to form a solid bull defense line. Downwards lies the yearly low of 3940. Regarding indicators, the MACD continues to rise towards the zero axis with an extremely flat slope; the RSI still oscillates in the neutral zone, maintaining the balance between bulls and bears for gold prices for a period of time.
Looking at the 4-Hour Chart, spot gold was "strictly restricted" in a narrow range of $100 up and down over the past week. Looking at upside potential, the mirror image of gold's high and low points in late June at 4100 repeatedly suppressed bull attacks last week; only by breaking through can it continue to challenge the dense area of lows in December last year at 4165, and the mirror level of mid-to-late June at 4215, etc., which are daily box top areas. Conquering the latter will take a key step in building a bottom in the medium and short term, and the market will also use this opportunity to release the powerful momentum accumulated after breaking the descending wedge earlier in July. Regarding indicators, both MACD and RSI are fluctuating up and down in the neutral zone, far from clarifying the trend direction.
Resistance Levels: 4100, 4165, 4215
Support Levels: 4025/00, 3940, 3885
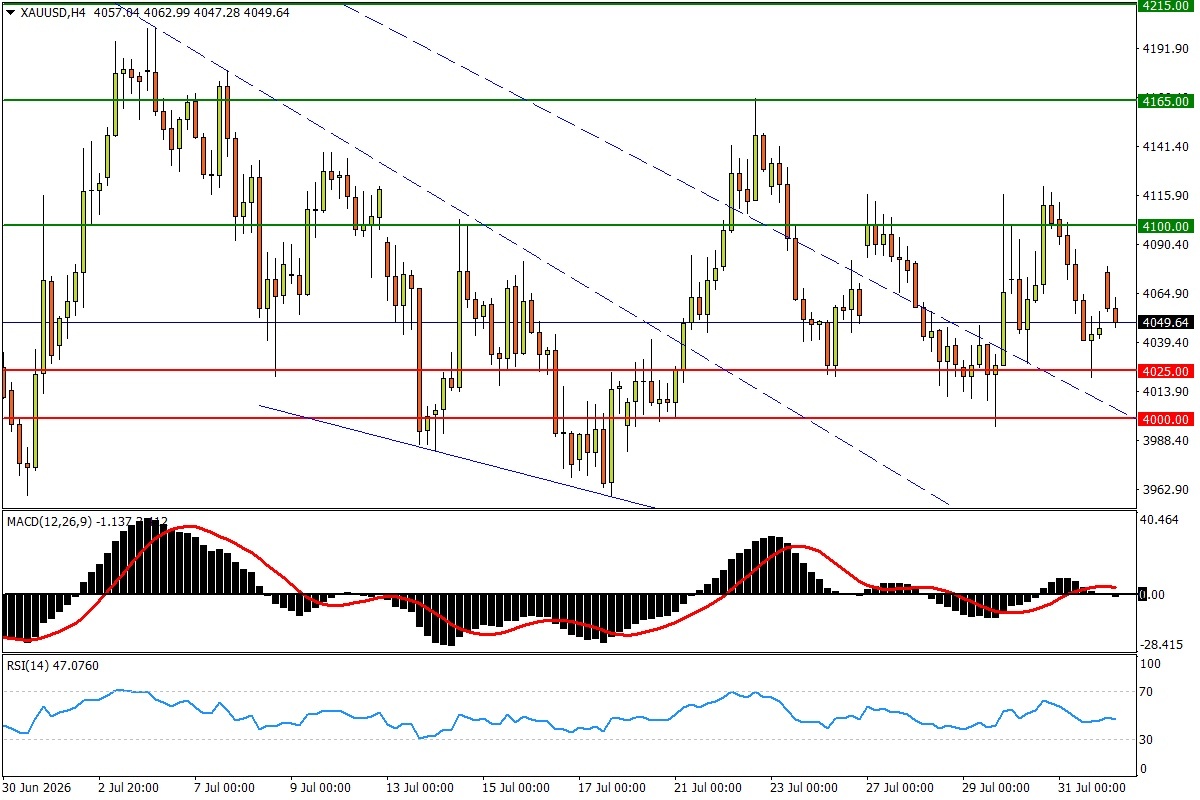
* XAUUSD H4 Source: FXTM
The copyright of this article belongs to the original author/organization.
The views expressed herein are solely those of the author and do not reflect the stance of the platform. The content is intended for investment reference purposes only and shall not be considered as investment advice. Please contact us if you have any questions or suggestions regarding the content services provided by the platform.
