股东总回报率
阅读 2149 · 更新时间 2024年12月5日
股东总回报率(Total Shareholder Return, TSR)是衡量公司在一定时期内为股东创造的总回报的一个重要指标。它包括股息收入和资本增值两个部分。具体来说,TSR 是指某一时间段内,股东通过持有公司股票所获得的总收益,包括股票价格的增值以及股息的再投资收益。TSR 的计算公式为:其中,Pend 是期末股价,Pbegin 是期初股价,D 是期间内发放的股息总额。TSR 能够全面反映公司股东所获得的实际回报,是投资者评估公司绩效的重要指标。
定义
股东总回报率(Total Shareholder Return, TSR)是衡量公司在一定时期内为股东创造的总回报的一个重要指标。它包括股息收入和资本增值两个部分。具体来说,TSR 是指某一时间段内,股东通过持有公司股票所获得的总收益,包括股票价格的增值以及股息的再投资收益。TSR 的计算公式为: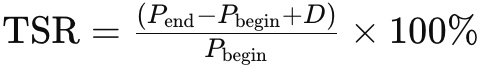
起源
股东总回报率的概念起源于 20 世纪后期,随着投资者对公司绩效评估的需求增加而发展。它最初用于帮助投资者更全面地了解公司为股东创造的价值,而不仅仅是通过股价的变化来衡量。
类别和特征
TSR 可以分为两大部分:股息收入和资本增值。股息收入是指公司在特定时期内向股东支付的现金分红,而资本增值则是指股票价格的上涨。TSR 的优势在于它能够全面反映股东的实际收益,但其缺点是可能受到市场波动的影响。
案例研究
一个典型的案例是苹果公司(Apple Inc.),在过去十年中,其股东总回报率一直保持在较高水平,这得益于其股价的持续上涨和稳定的股息支付。另一个例子是可口可乐公司(Coca-Cola),其通过长期的股息支付和股价的稳步增长,为股东提供了可观的总回报。
常见问题
投资者在使用 TSR 时常见的问题包括:如何准确计算股息再投资收益,以及如何在市场波动中评估 TSR 的可靠性。通常,投资者需要结合其他财务指标来全面评估公司的绩效。
免责声明:本内容仅供信息和教育用途,不构成对任何特定投资或投资策略的推荐和认可。